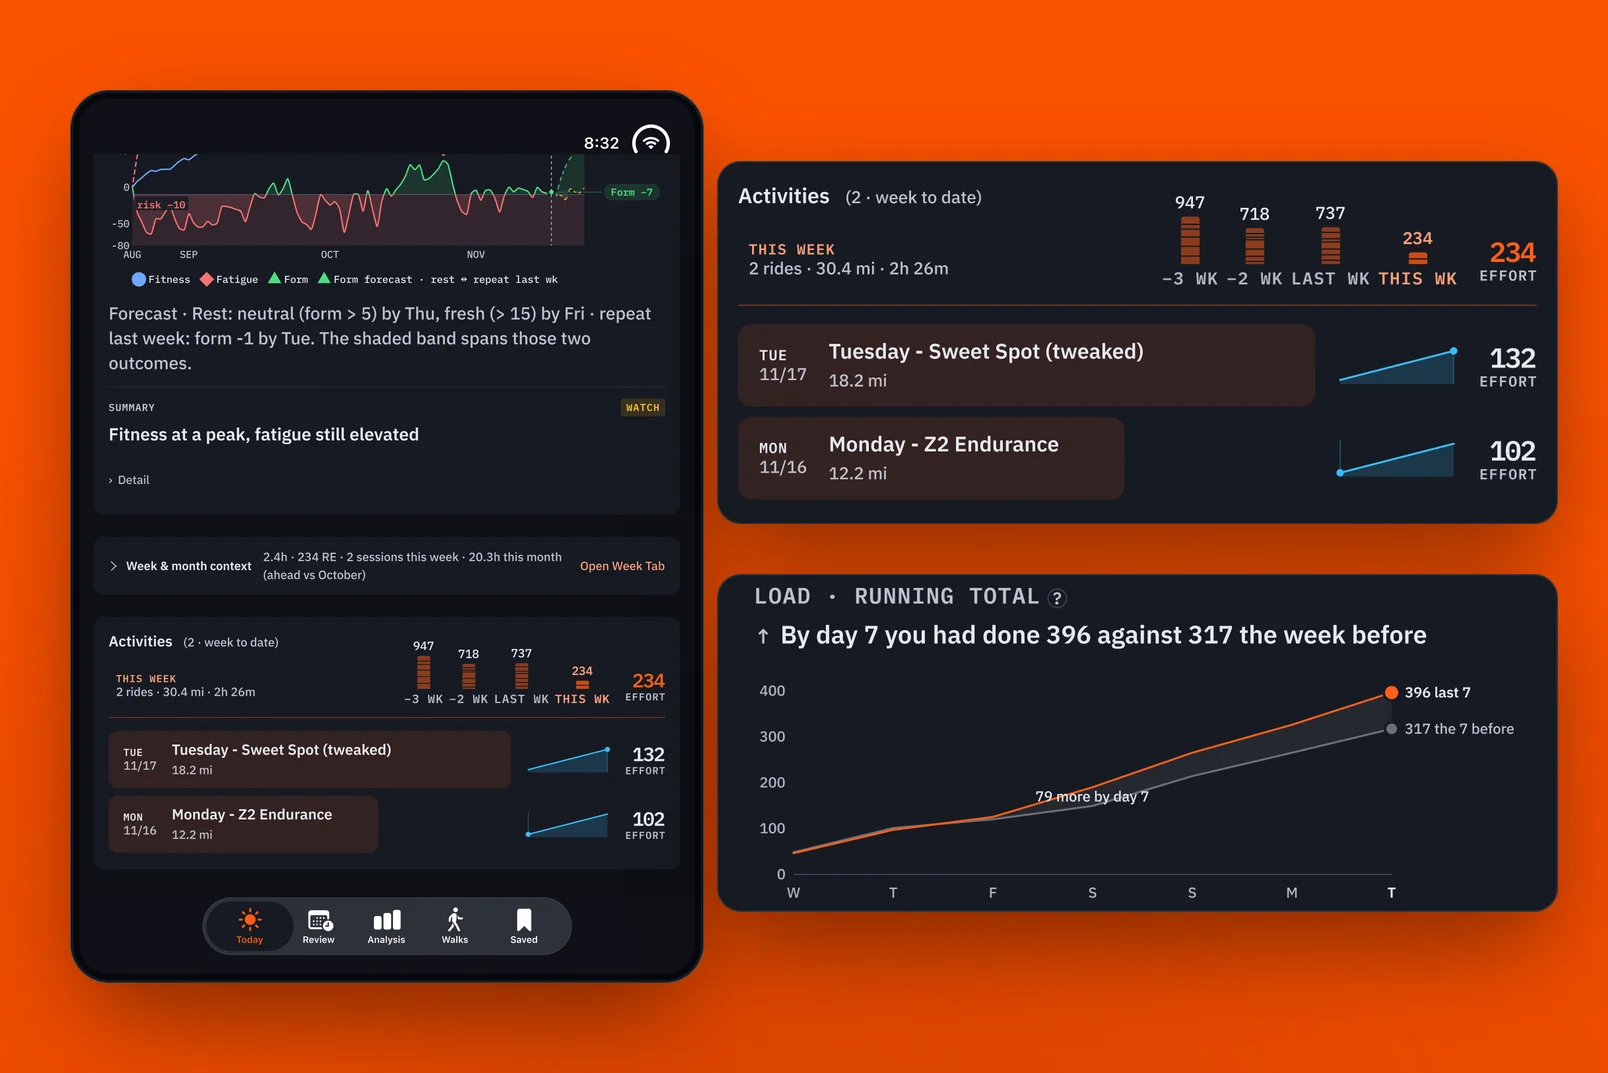
Strava Dashboard
Foolscap #1: Designing for attention.

Strava Dashboard · Foolscap #1: Designing for attention
The one-page sheet
Theme: Months of daily iteration turned a dashboard for looking back at rides into one that answers only what I need to know, with little to no effort.
Hero: Me, as both the rider and the designer.
Antagonist: First, the generic AI summary that couldn't tell me how my ride really went. Then, training hard without results. Finally, my own finite attention.
Act One: Strava's summary isn't enough. I start wide, exploring what Strava data I have and how I can visualize it differently, comparing each ride with yesterday, last week and last month.
Act Two: I tweak the app every day. The fitness and freshness graph becomes the one that matters most. But I'm burning my engine without much to show for it. I use AI to study a year of data and build HRV Ride, and Strava's purpose changes.
Act Three: The app now answers three questions after every ride and gives me week, month and year trends without clicking around. I don't study every card, but the visualizations are what make the data feel real.
Starting wide
This was the dashboard that started everything. I wanted to understand how my ride went beyond what Strava's generic AI summary was telling me.
I wanted to place each ride in context with the others. How did it compare with yesterday's ride, or the same day last week? How was it adding to the week and month so far? How did it compare with last week and last month, and how did it fit into the bigger trends for the year?
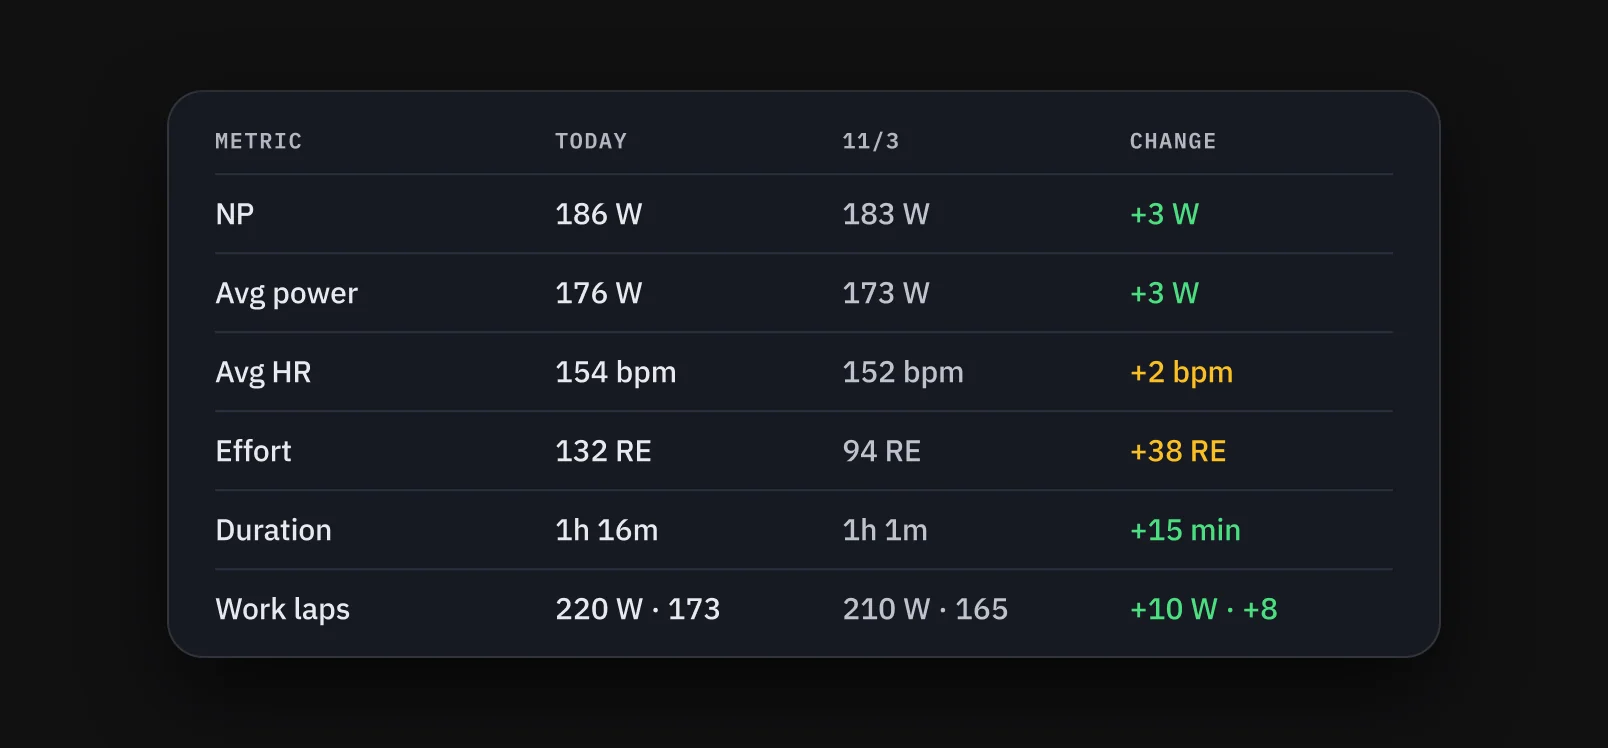
I started really wide, looking at what Strava data I had and how I could visualize it differently from the Strava app. It became the launching point for many of the questions I would start asking about my health.
Iterating every day
This was a very iterative process. I tweaked the app every day for many months. Each morning I would look at it and decide what was useful for my understanding and what wasn't. Did I really dig into the data? Did I really analyze each day against the last? How could I streamline the things I needed to know without switching between tabs?
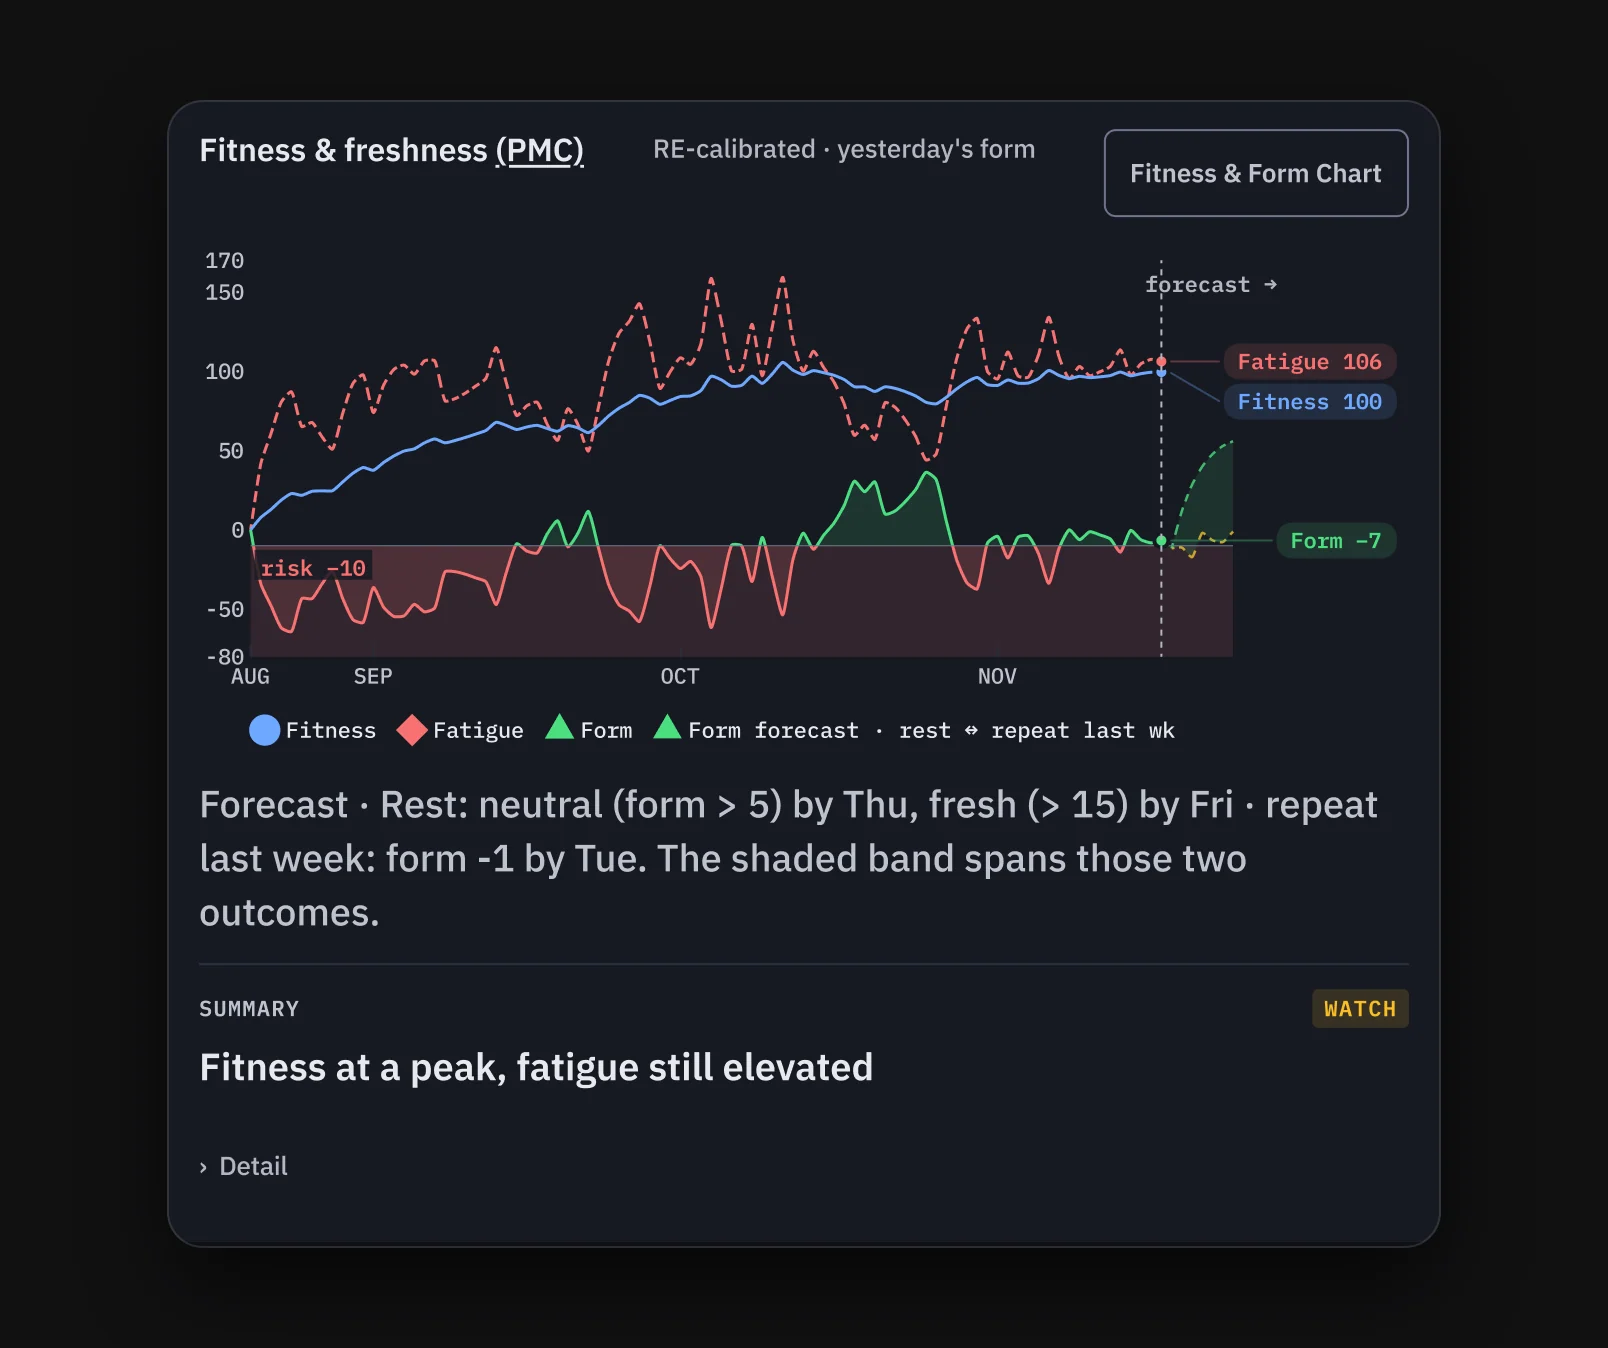
It gave me a chance to explore ways of visualizing data I hadn't tried before, and I experimented a lot with combining two or three data points into one view. The graph that meant the most to me brought fitness, fatigue and form together: the fitness and freshness graph, or PMC. It really helps put my current fitness into perspective. I can see when I'm above the line in green, compared with when I was really burning downward in red.
The app also tracks routes, keeping a record of each map and its elevation. It isn't as helpful as a real-world ride, but it does make it easy to forget I'm on a stationary bike.
My typical week has three hard days, with easier days before and after them. For a while, though, I was really burning my engine without much to show for it: no real increase in my FTP or HRV. I used AI to look at a full year's worth of data to see which patterns my body responded to best. The questions shifted from what the data looked like to what AI could do with it to help me understand, and how it could change my workouts.
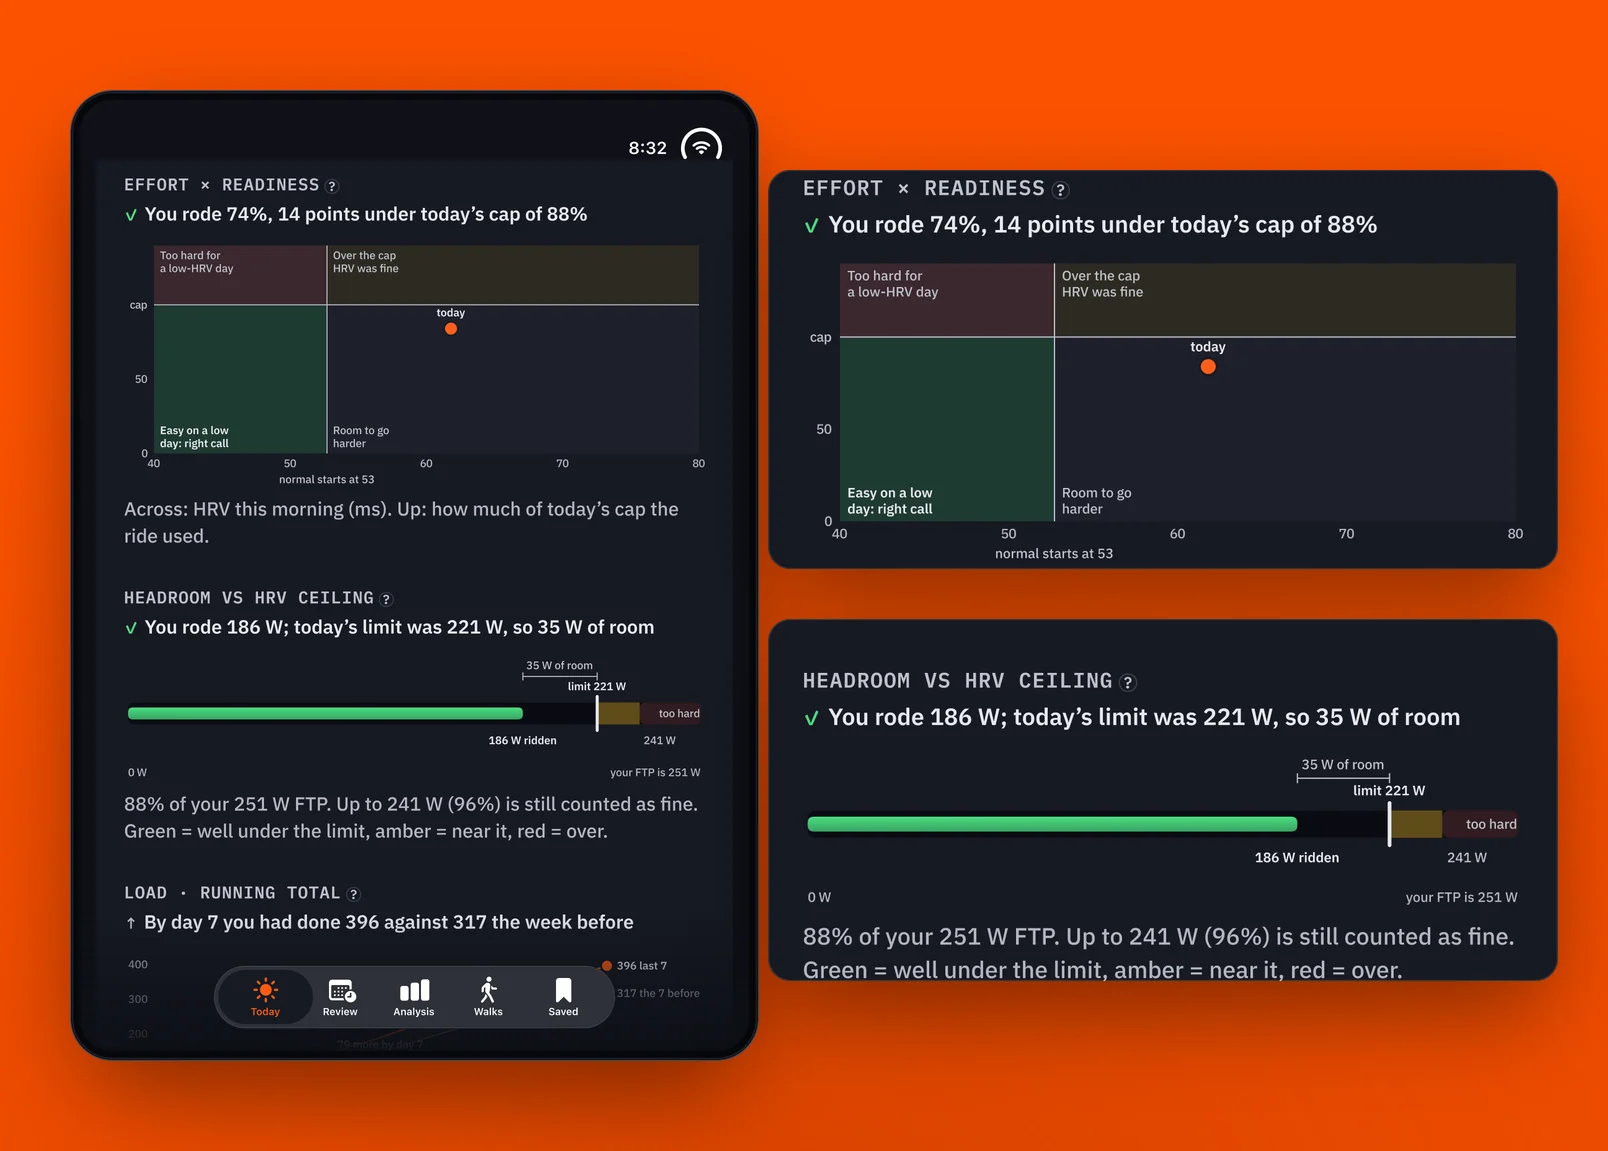
That led to HRV Ride, the app I now use to create my workouts. It takes data from my previous rides and builds a workout that I upload to Zwift. Alongside it is Signal, my "doctor in my pocket" app. It isn't a real doctor, but it takes my Apple HealthKit and Whoop data and gives me an analysis of how I'm doing when I wake up. It helps me understand my current physical state in a way individual data points might miss.
Once I started designing and using HRV Ride, Strava's purpose changed. In theory, HRV and my fitness score together point to the ride my body most likely needs, not just a comparison of cycling metrics. The data became more of an API driver for my other apps, and I spent less time looking at the comparisons I had built. Strava is now the only one of my apps that uses data from the ride alone. In effect, it's a laggard, and it comes last in the flow.
Three questions
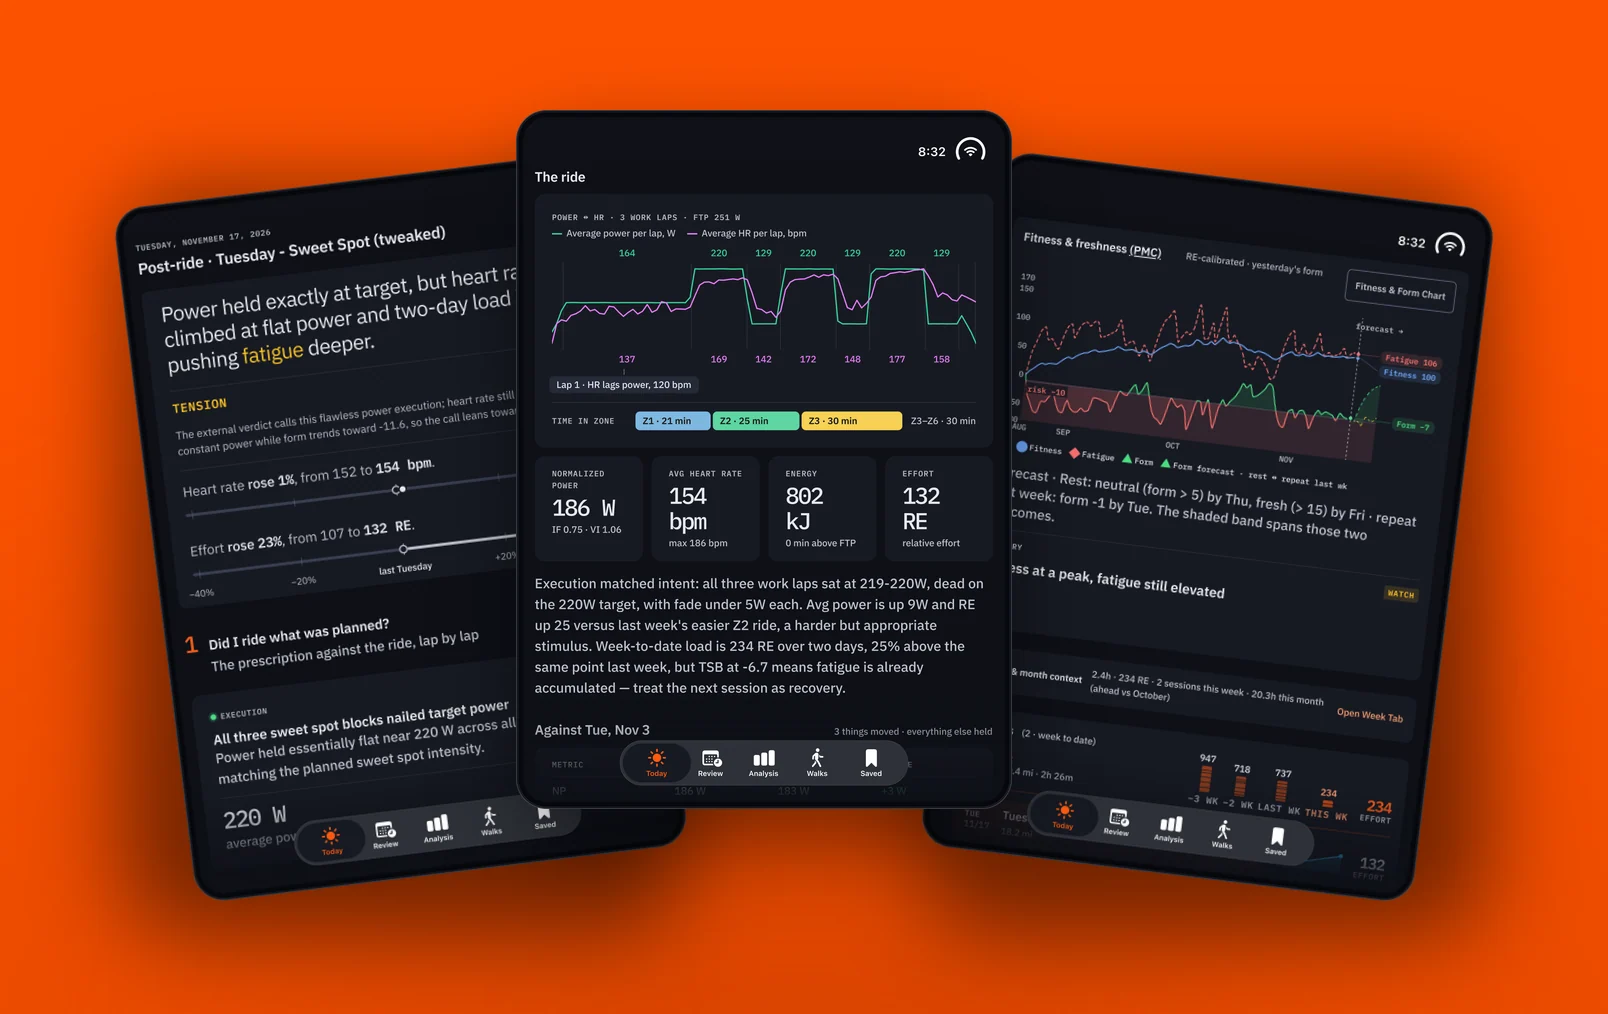
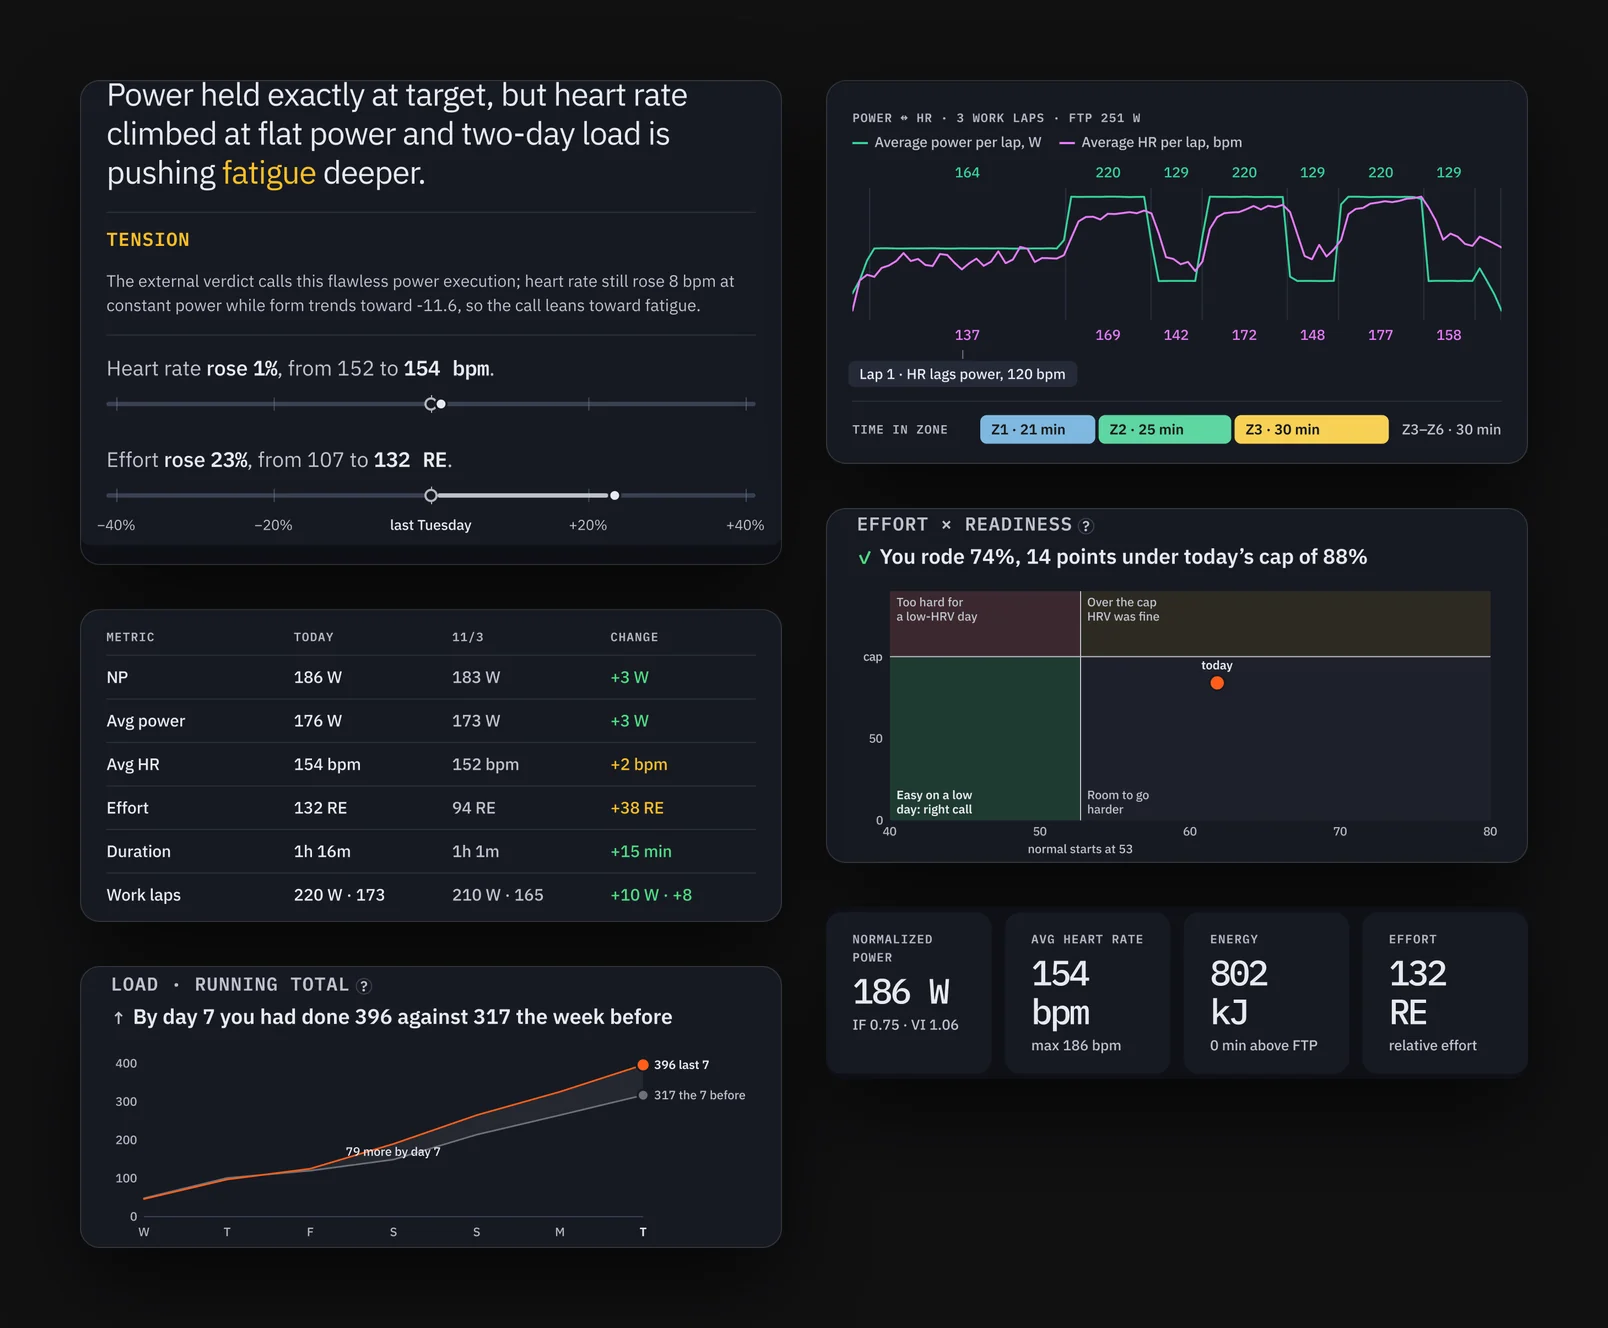
Strava became less about pre-planning and making workouts, and more about reviewing what I had just accomplished, learning from it, and making my week and month easy to read with little to no clicking. Immediately after a ride, the app answers three questions:
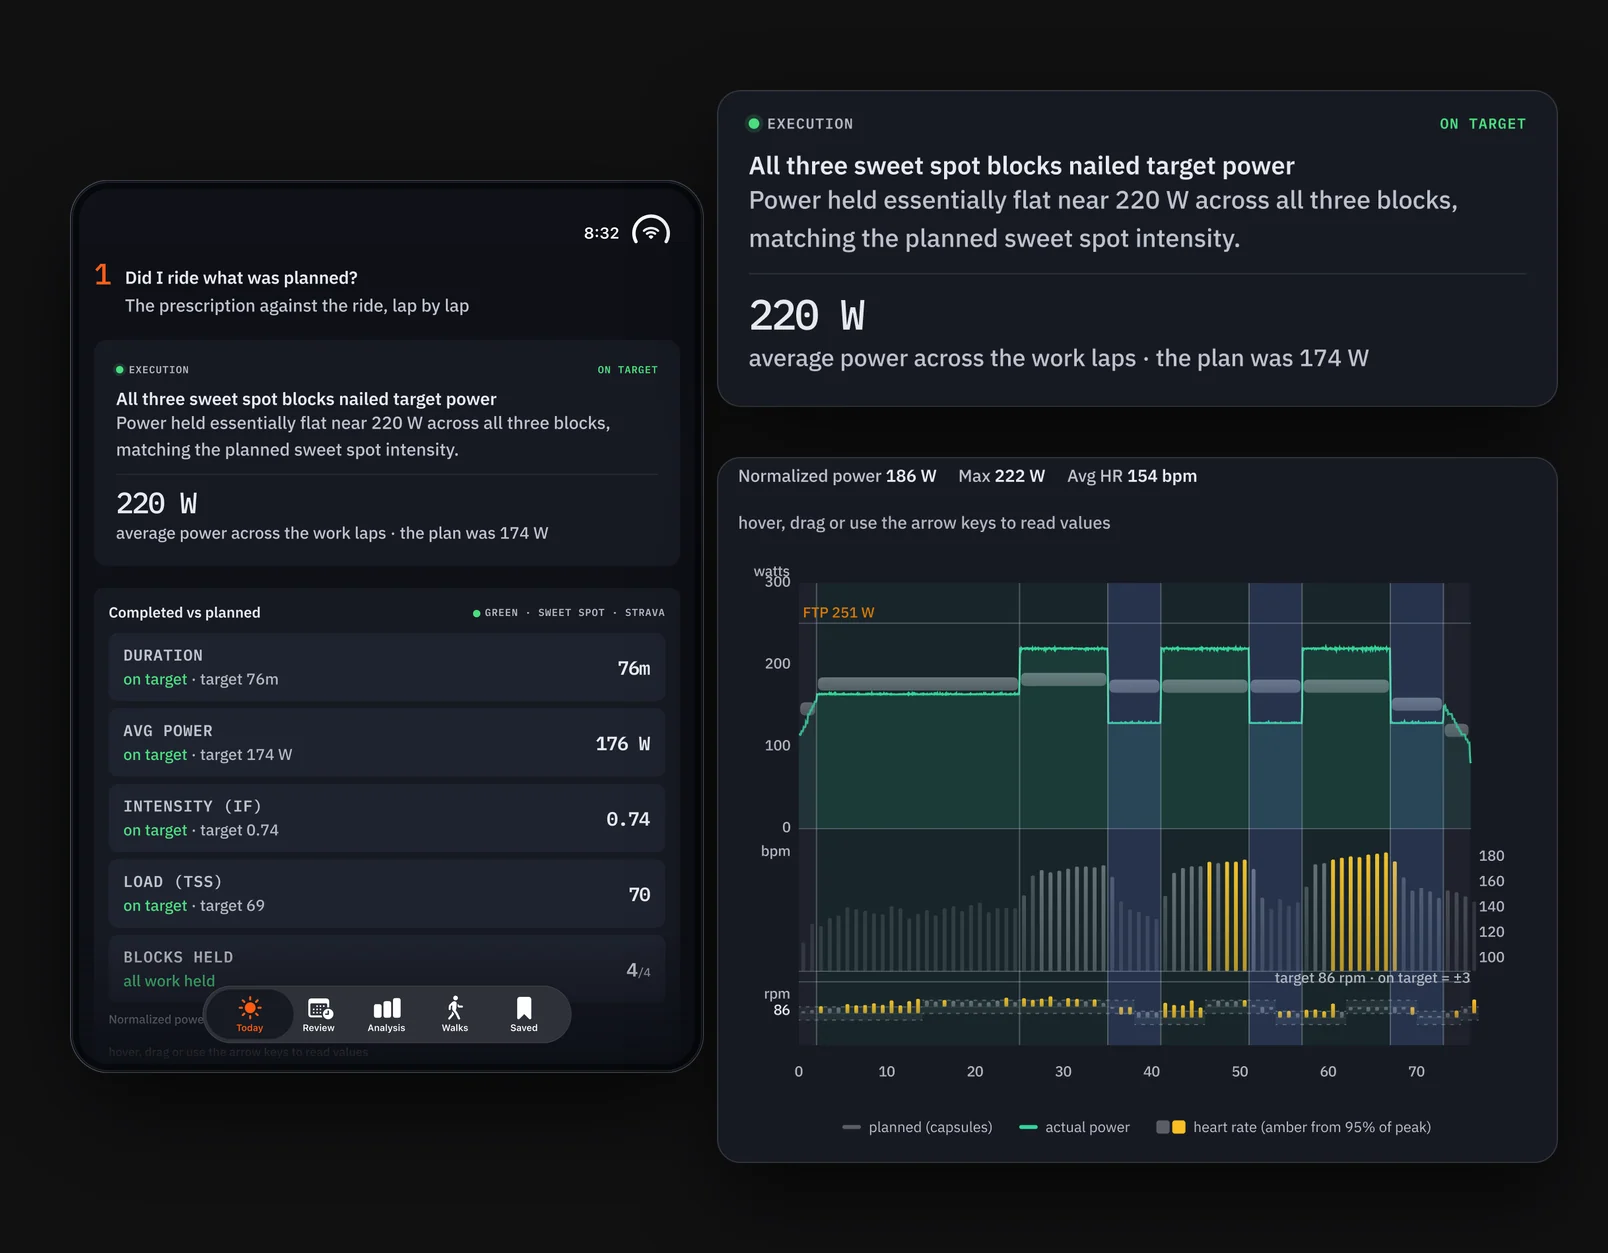
1. Did I ride what was planned? I've just completed a ride that was recommended to me.
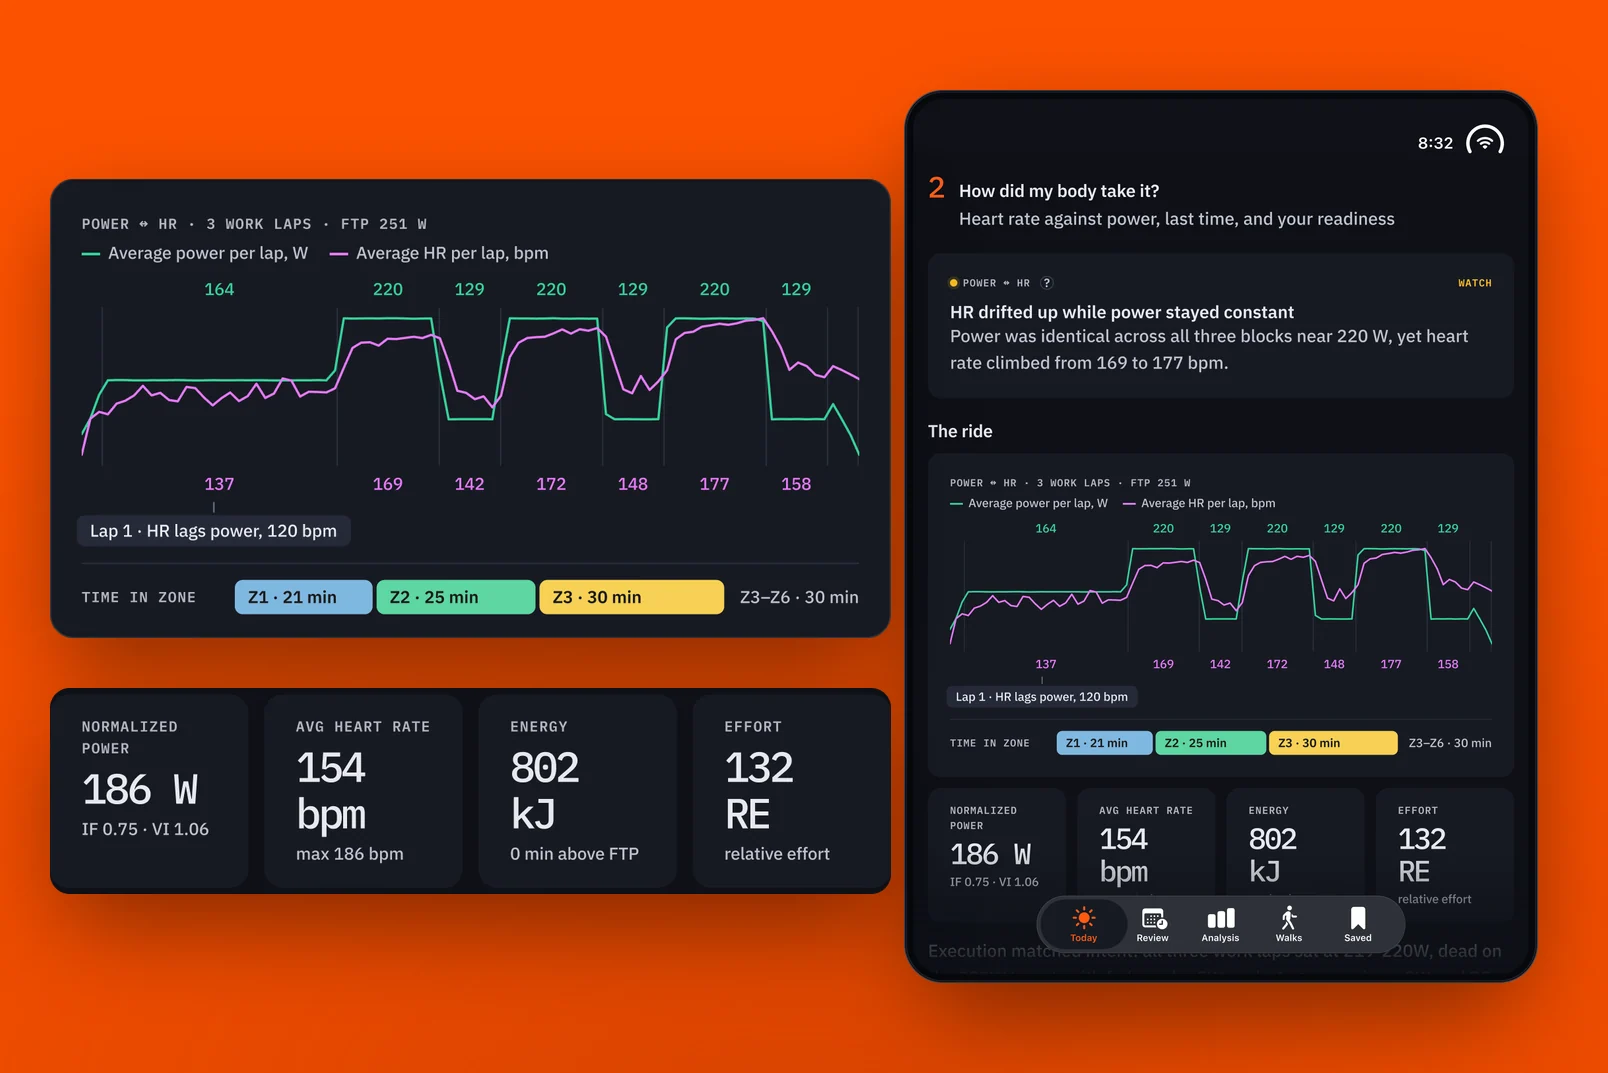
2. How did my body take it? I want to know, from a physiological perspective, whether my body responded the way the ride intended. Was my heart rate in the zones it should have been, or did it go higher? If it went higher than planned, by how much?
3. What does it do to my week? Now that the ride is done, does it fit my energy budget, or did it go well off in one direction or the other? Will I need to lighten the intensity over the next couple of days, or put in more effort?
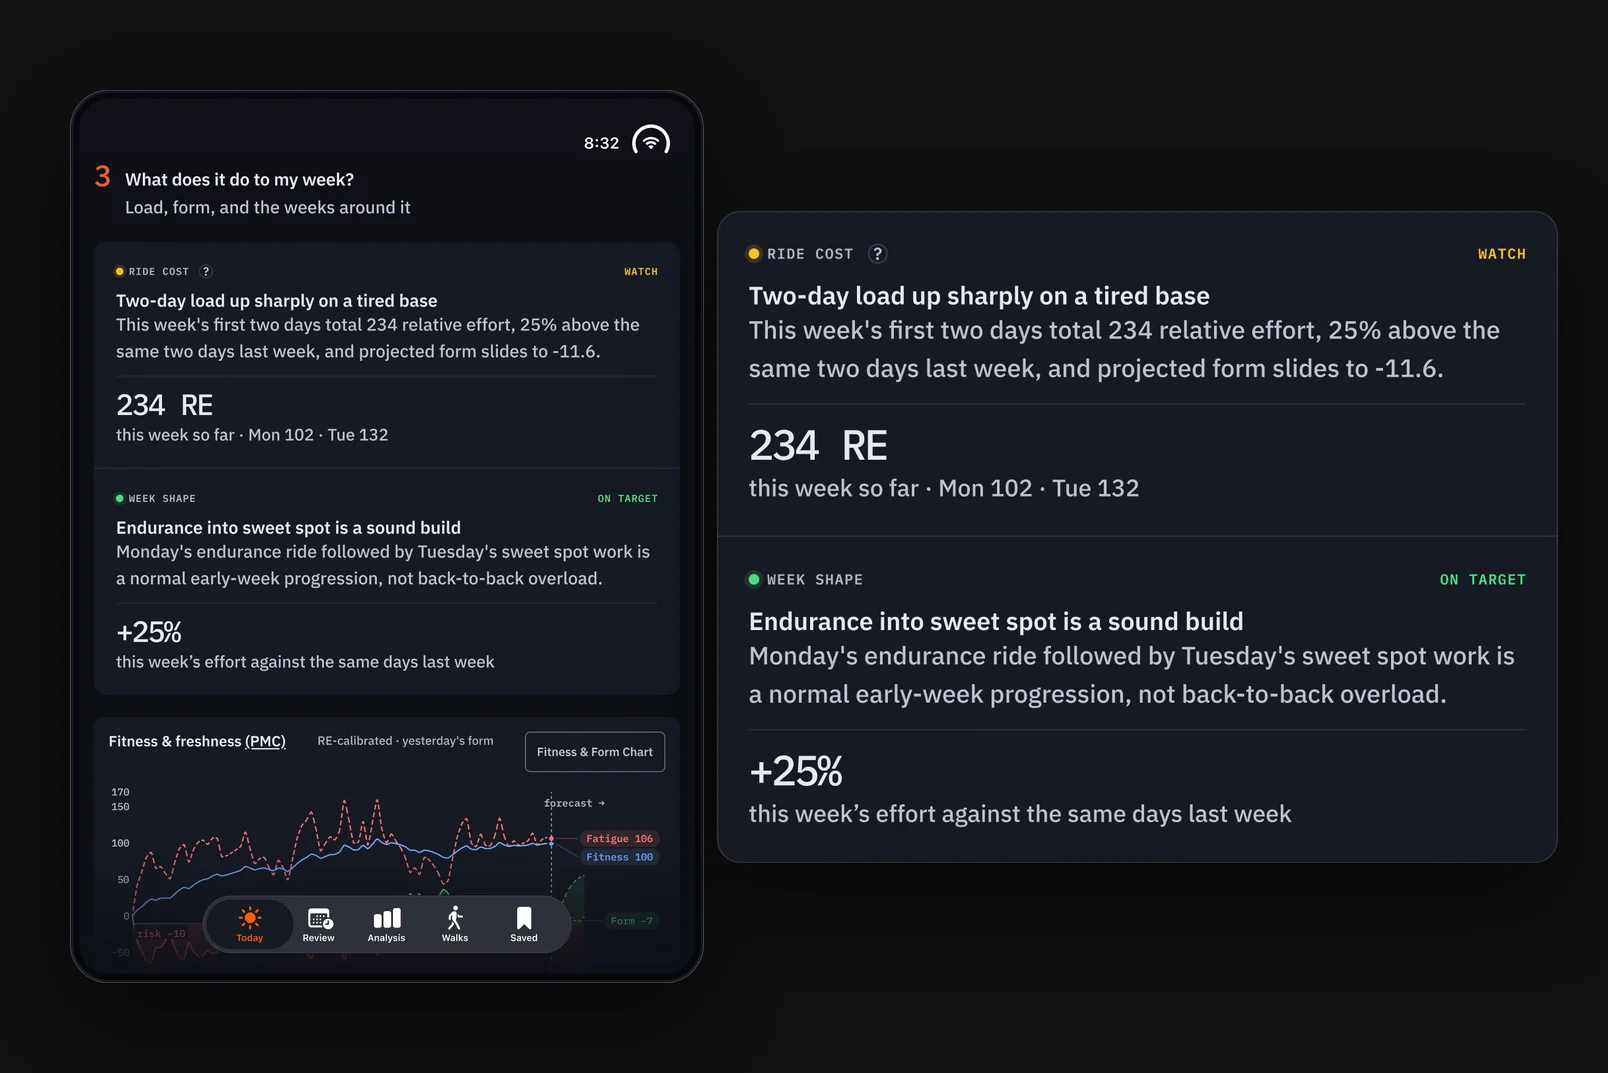
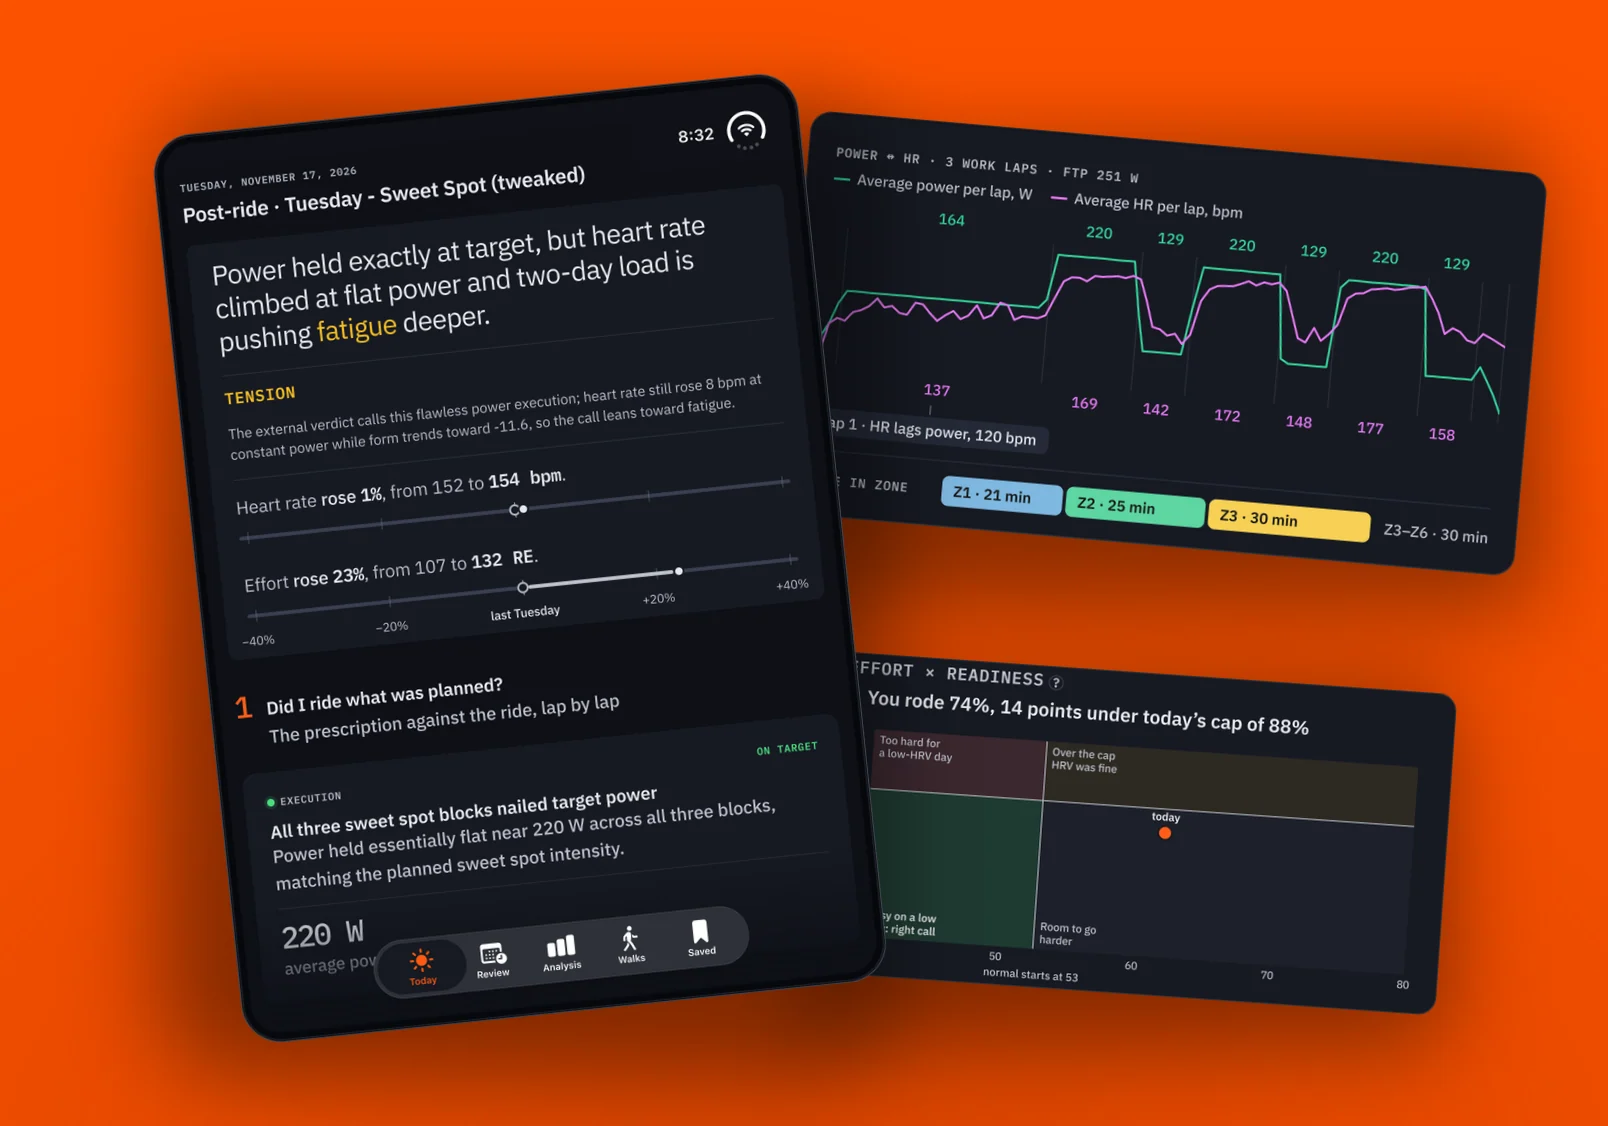
Usually the answers land where I'd expect them to, if the plan is doing its job. In aggregate, the data helps at the end of the week and month to show me how my riding fitness really went. One off day, or one exceptionally good one, doesn't change the monthly trend much, and the trend is what I'm curious about. With my new workout setup, I'm staying in the green on the PMC a lot more. The workouts adjust more granularly and give my body more time to recover, which in turn is helping my fitness.
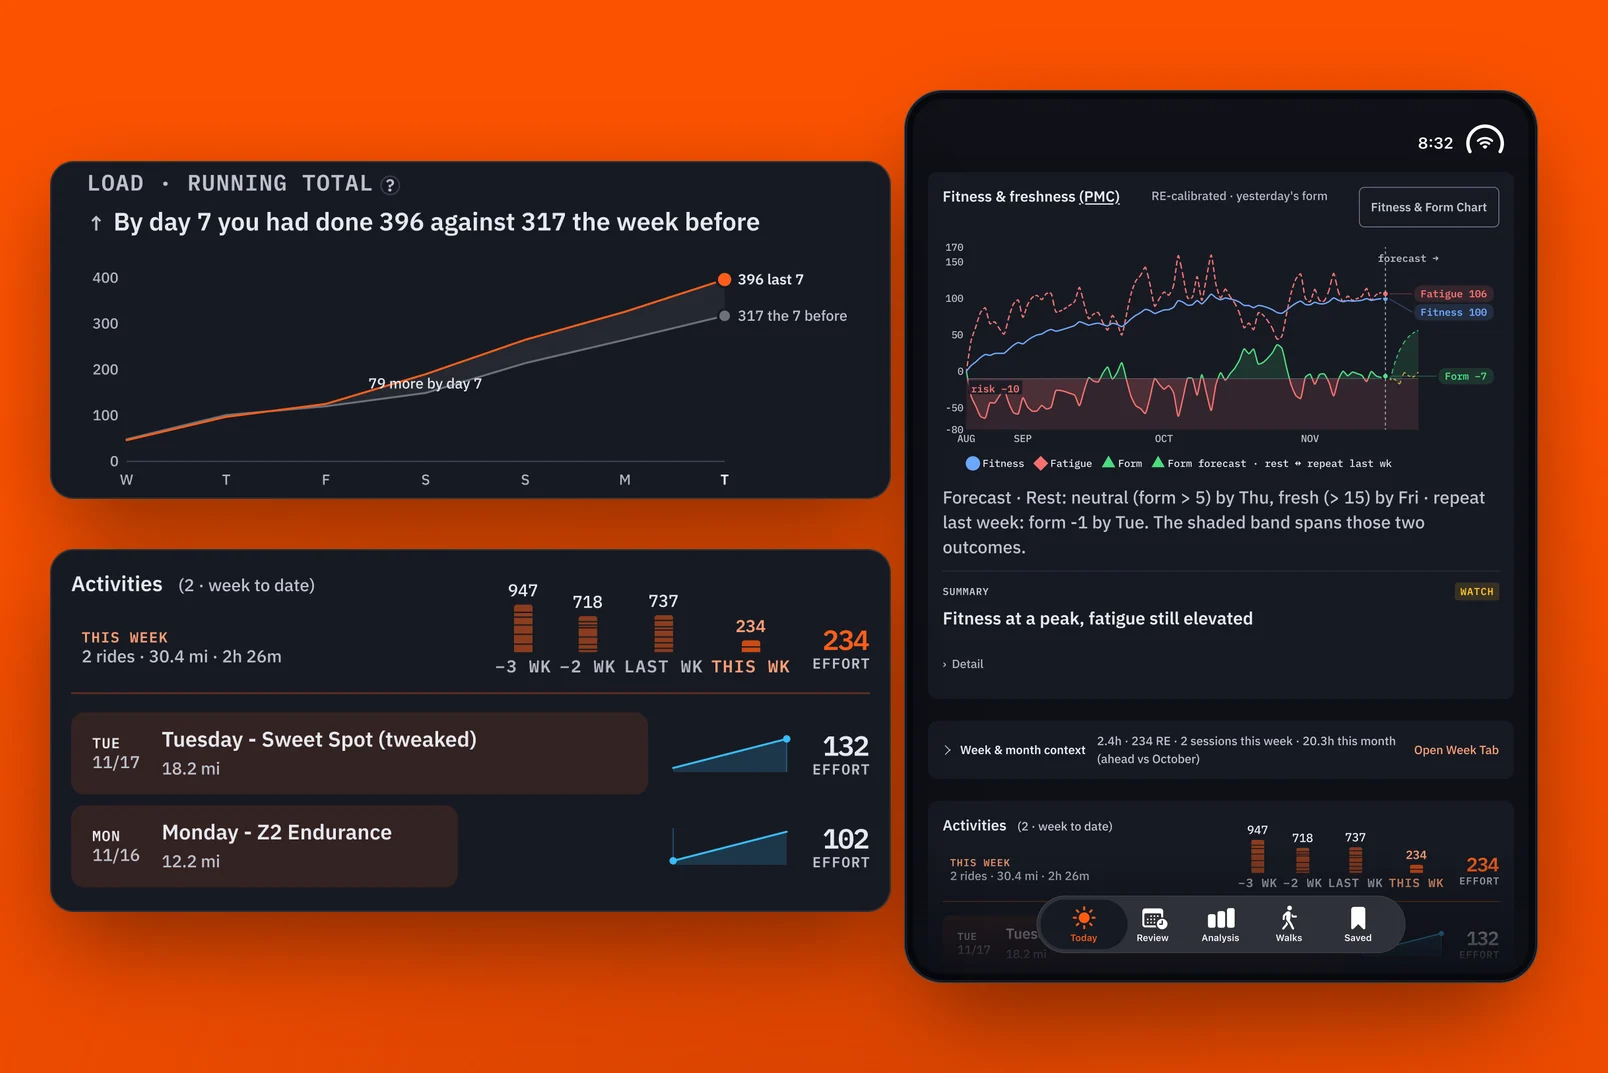
Moving from the web to iOS helped from a practical perspective. I can look at the analysis on my iPhone right after a ride, instead of waiting until I get to my computer after I've showered. In practice, I either look at it right after a ride or not at all that day, and sometimes I only check in at the end of the week or month.
It's not that I don't find the information interesting. But what am I going to spend a finite amount of time looking at? This data directly shapes the next workout, which is great. After a while I know where the data comes from and how it influences the workout, so I'm less likely to study each data card. On the other hand, if I didn't have the visualizations, I wouldn't take the data as seriously as I do, as something real.
What's next
I don't spend much time in the pre-ride view. It has coach's notes left over from the early days, before HRV Ride. Seeing the week and month in context is useful, but I could bring those over to HRV Ride. For now, I like that Strava keeps this data set separate from my other health metrics.