SignalA team of doctors in your pocket, read as a design problem: years of Whoop and Apple Health data turned into a morning conversation.
Case study
Nov 2026
02
HRV RideAn app for an audience of one. Every ride is a round of user testing, and every ride that breaks down is a bug report.
Case study
Nov 2026
01
Strava DashboardMonths of daily iteration turned a dashboard for looking back at rides into one that answers only what I need to know, with little to no effort.
A team of doctors in your pocket, read as a design problem: years of Whoop and Apple Health data turned into a morning conversation.
I heard Greg Brockman on a podcast describe AI at its best as a team of doctors in your pocket: there for you, thinking continuously about how to help. The phrase stuck. I read it less as inspiration and more as a design problem.
An app for an audience of one. Every ride is a round of user testing, and every ride that breaks down is a bug report.
The app is the product, I'm the only user, and every ride is a round of user testing. When a ride breaks down, I trace what the AI logic missed and fix it. The rules evolve, and they need fixing less and less.
Months of daily iteration turned a dashboard for looking back at rides into one that answers only what I need to know, with little to no effort.
Theme: Months of daily iteration turned a dashboard for looking back at rides into one that answers only what I need to know, with little to no effort.
A team of doctors in your pocket, read as a design problem: years of Whoop and Apple Health data turned into a morning conversation.
Why I built Signal
I heard Greg Brockman on a podcast describe AI at its best as a team of doctors in your pocket: there for you, thinking continuously about how to help. The phrase stuck. I read it less as inspiration and more as a design problem.
I'd been tracking myself for years with Whoop, Strava and Apple Health, all collecting data I rarely looked back on. I was curious to use that data to learn what it would actually mean to have a personal doctor in my pocket. I built Signal in conversation with Claude Code.
The morning check-in
Every morning when I wake up, I open Signal to see how my body recovered from the day before, and how it responded that night while I slept.
I collect a lot of health metrics through my Apple Watch and Whoop. The challenge has always been understanding what they mean and how they fit into bigger trends. I had plenty of metrics, but I wasn't sure what the data was telling me. So I designed Signal for myself. I wanted control over how this data is presented to me, and over how it's turned into information, whether that's subtle health information or something more. That information, in turn, helps me learn more about AI using data points I'm already familiar with. I also wanted to learn how an agent like that could be created, and how I could tweak it over time.
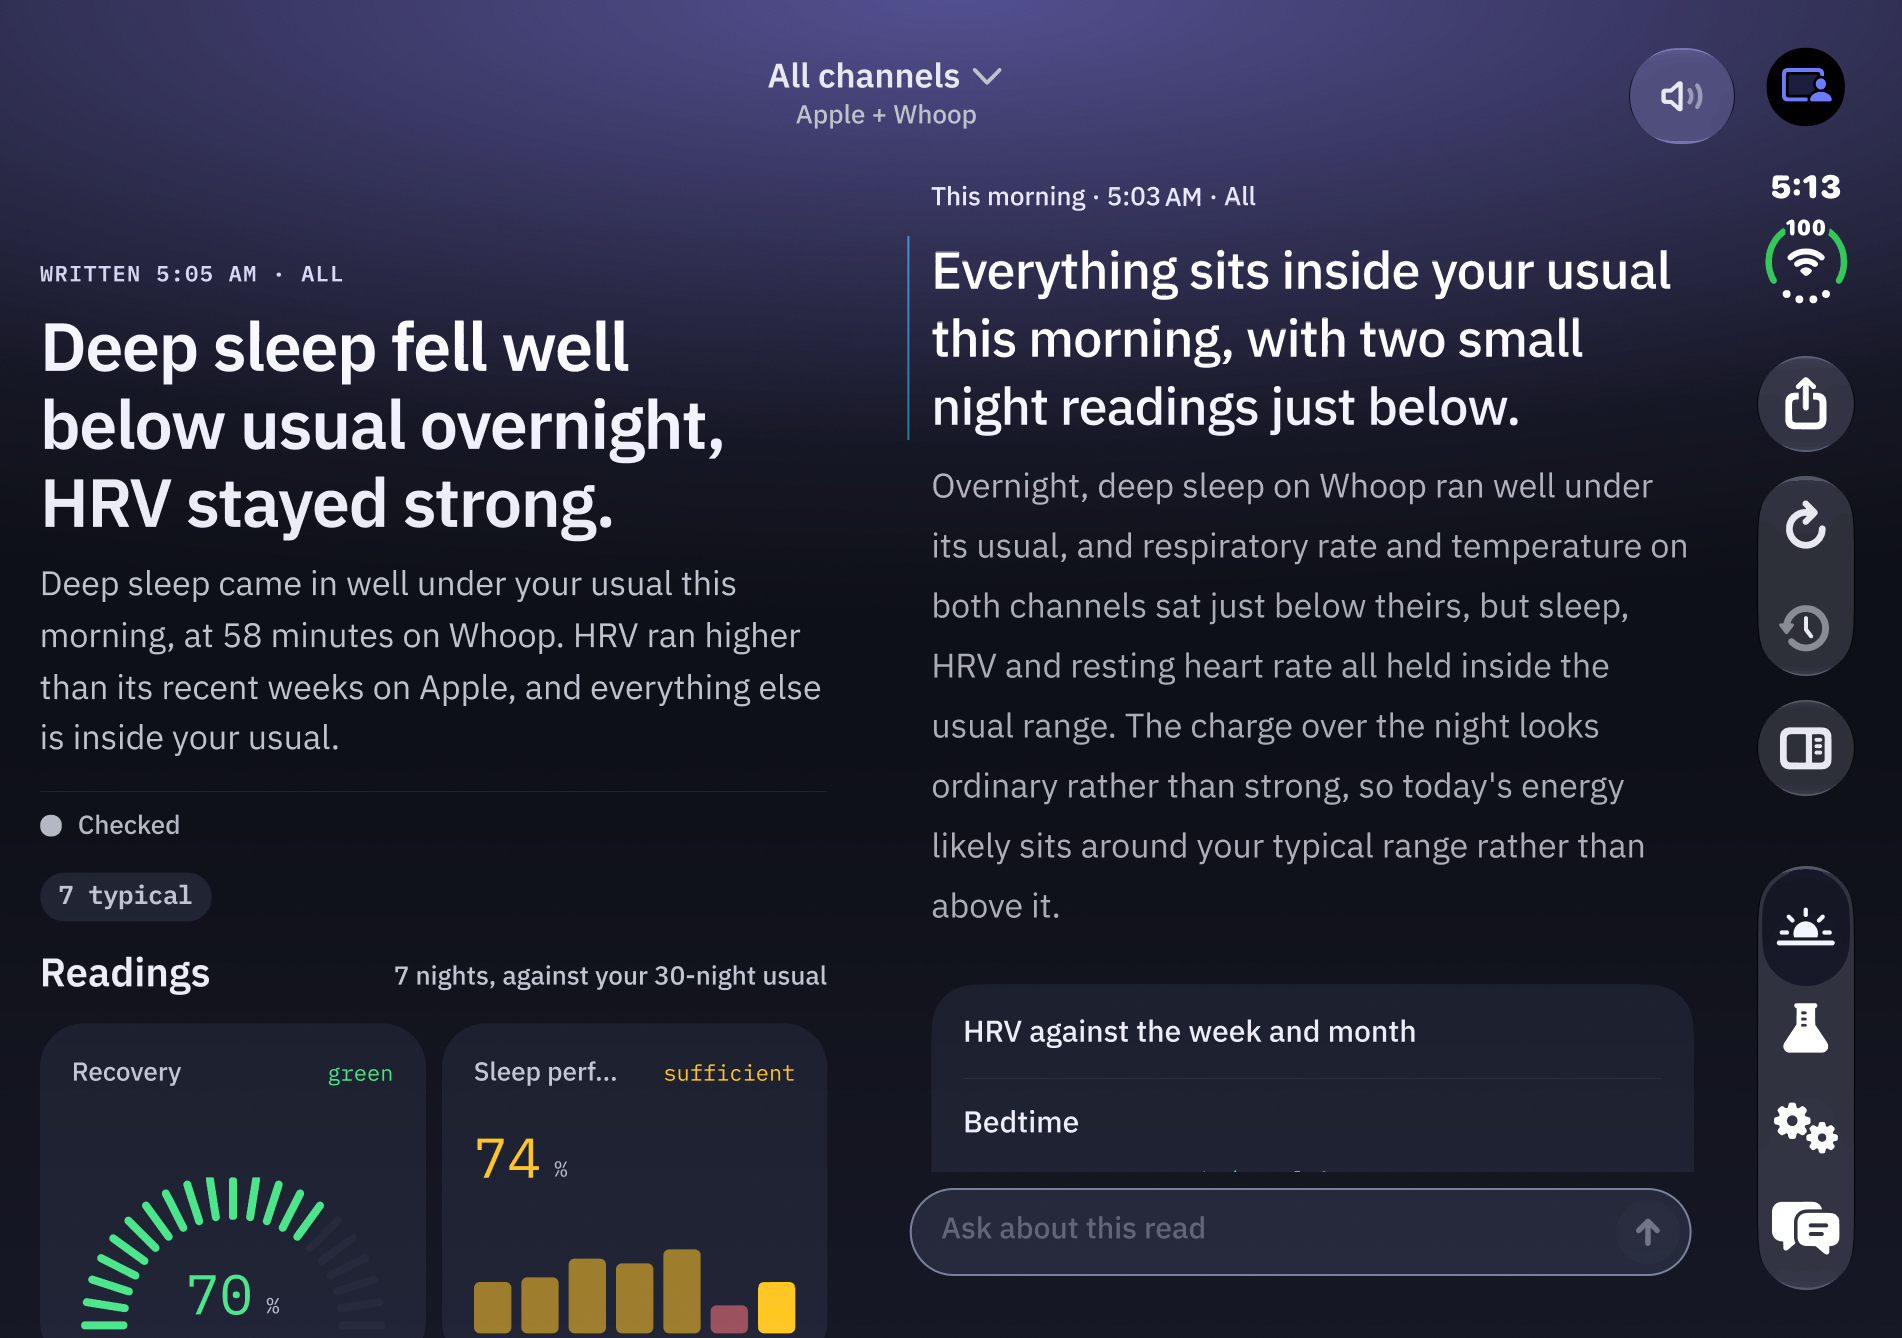
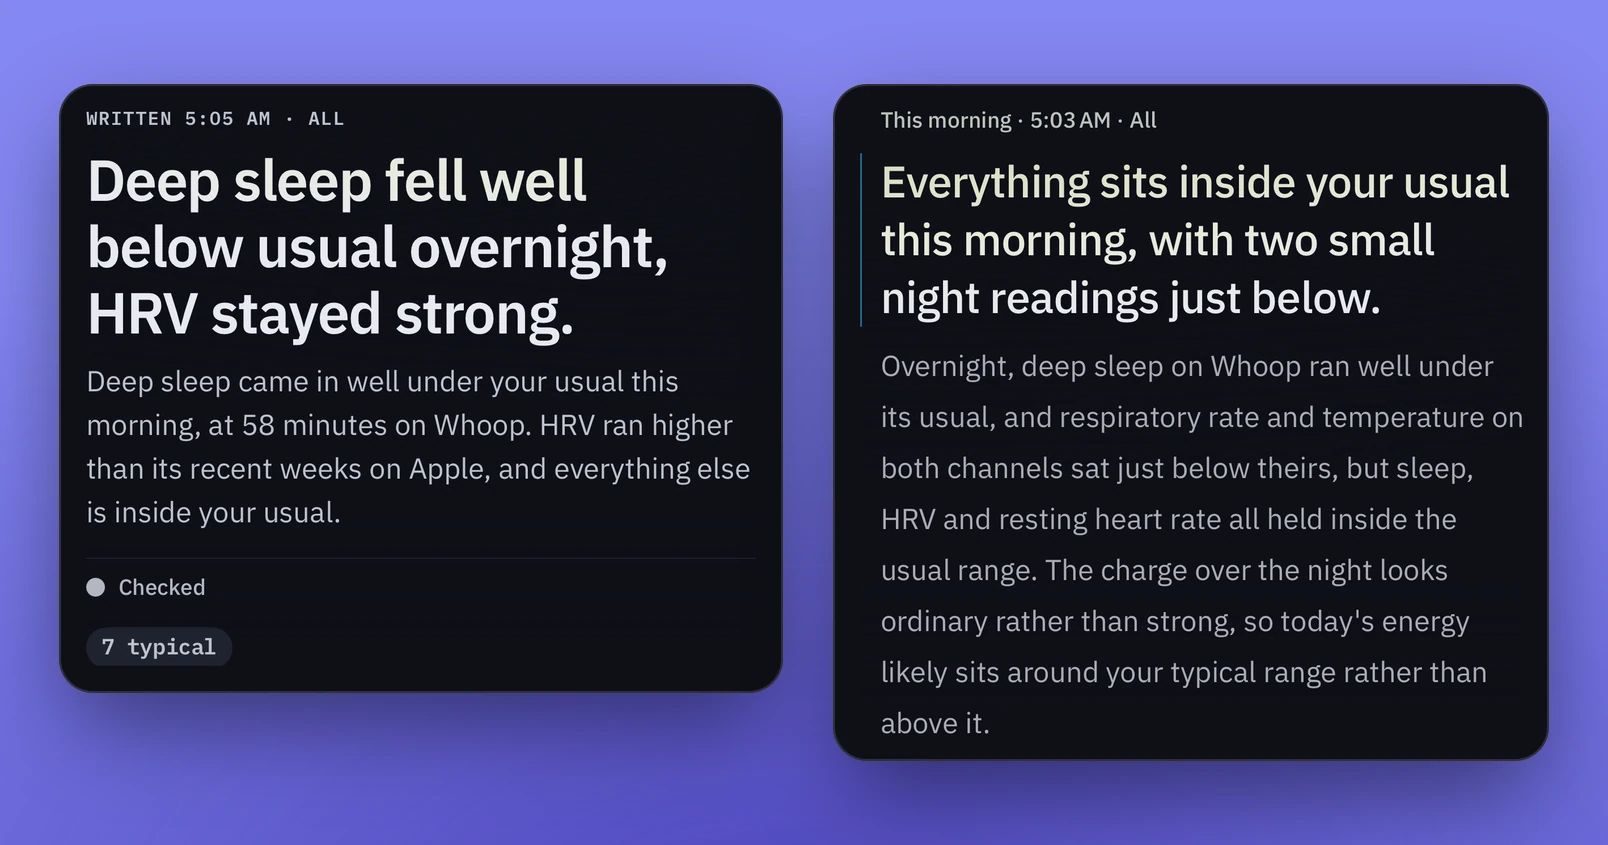
When I open the app, an agent has already collected my Apple HealthKit and Whoop data and analyzed it to explain what happened. It surfaces two or three data points, tells me what's normal and what isn't, and gives me a sense of how my day is likely to go.
Two reads of the same morning: what stood out, and how the day is likely to go.The audio read: Signal talks me through the morning.
The audio reads it to me while I'm organizing myself in the kitchen. Alongside that, a dashboard covers a broader range of KPIs I can learn a lot from at a glance. It's a helpful way to get context for the day.
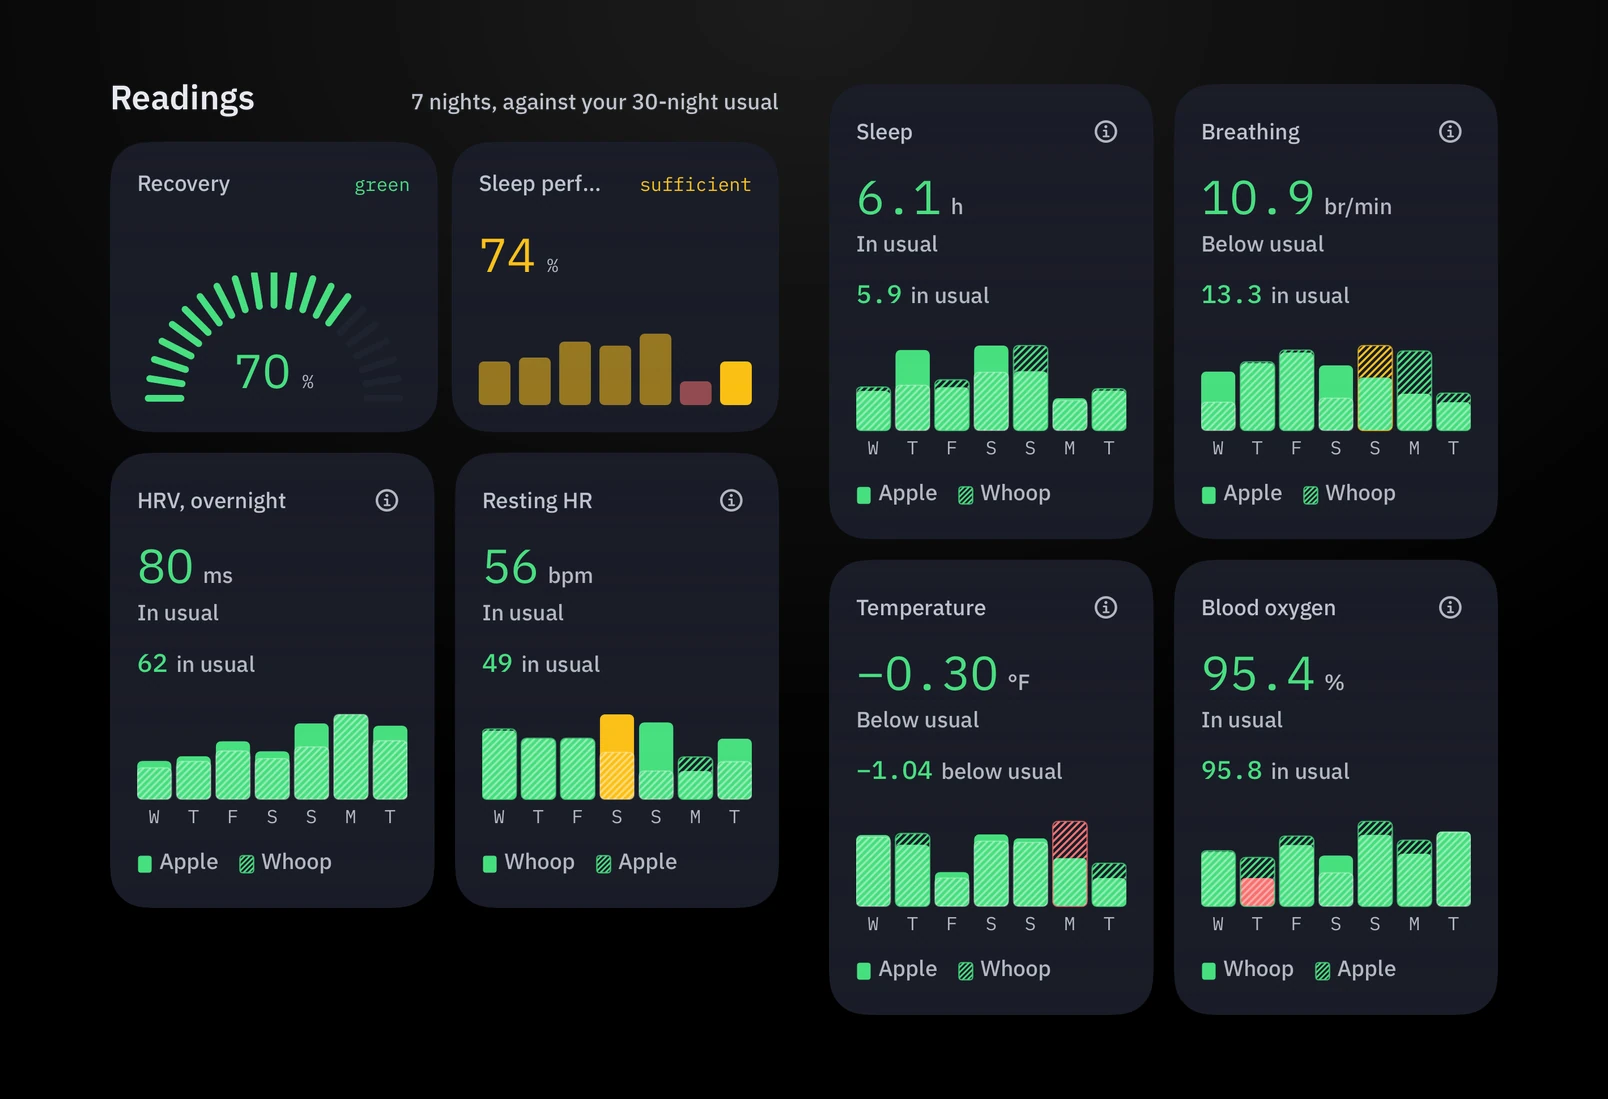
The dashboard: a broad set of readings, each against my usual.
The morning is only one part of it. The day is divided into different periods, and each one has a different focus.
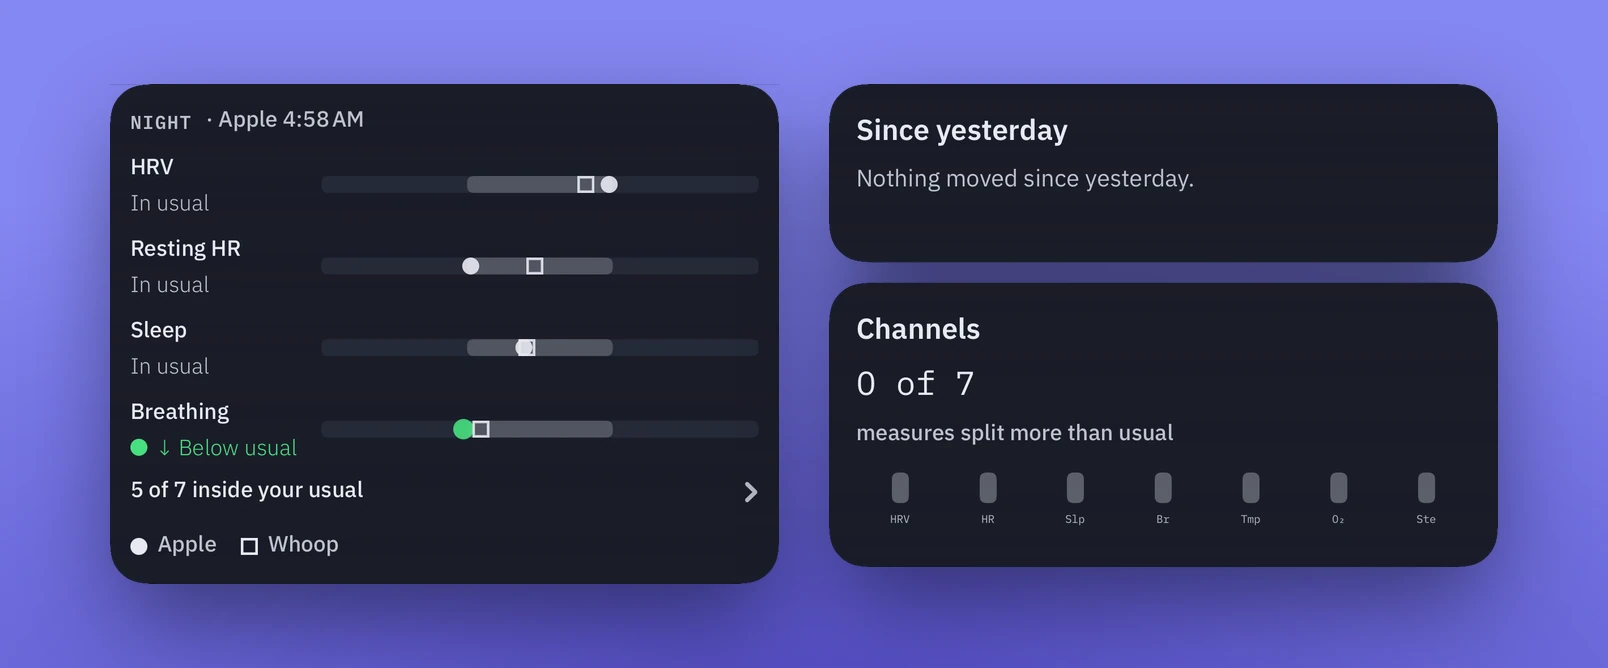
Right now: the night just gone, and what moved since yesterday.
Making sense of it all
From everything to what matters.
It didn't start this way. At first I had every imaginable data point visualized, but it didn't really help me. The question became: how could I turn that data into something that gets me up to speed really quickly? The next version was a simple readout with the data visualized, and the chat was there if I wanted to dig deeper.
A lot of data, in an order I can scan.
When two sources disagree.
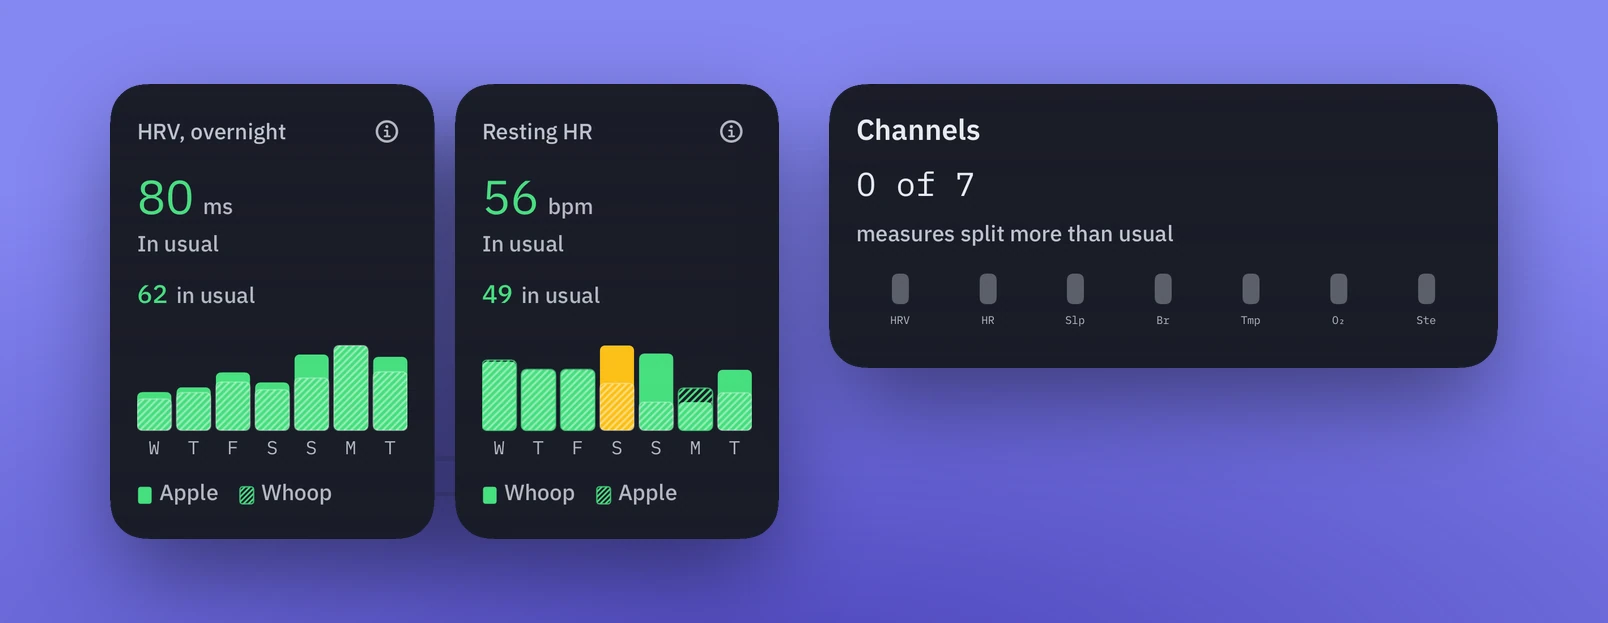
Signal draws on Apple HealthKit and Whoop. Where both capture the same type of measurement, I compare them side by side. One data point becomes the focus, with an explanation of why. Where the two sources differ significantly, Signal shows that too.
Apple and Whoop side by side, and how often they split.
Going deeper without getting lost.
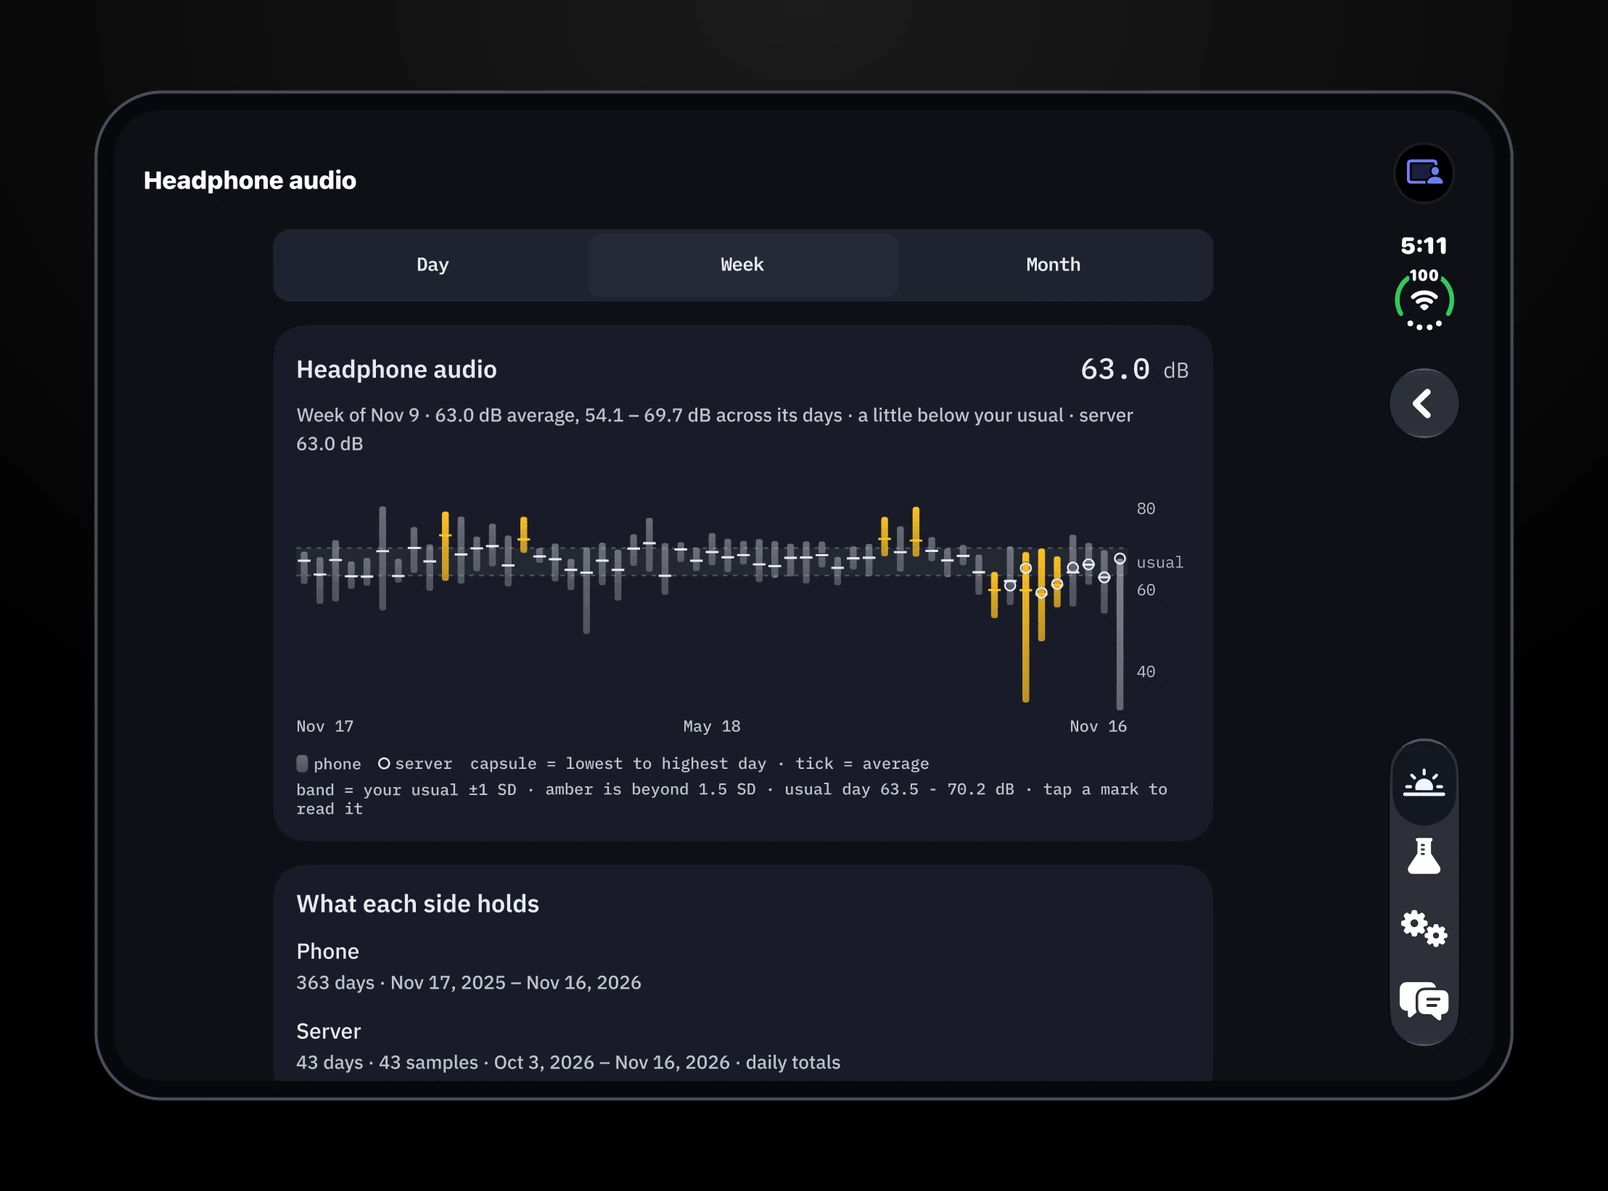
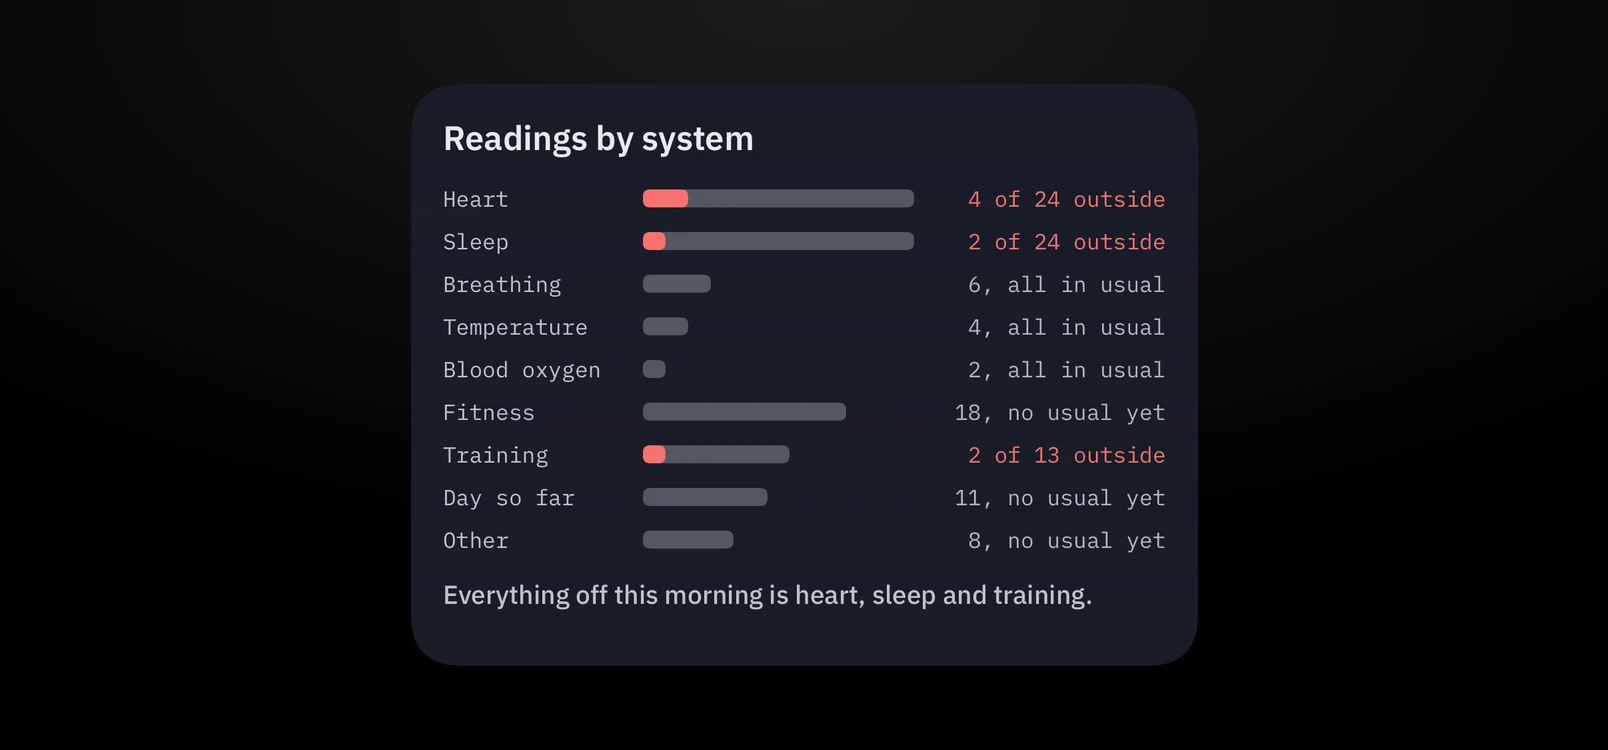
The dashboard displays the data in formats designed to go deeper the more I dig in. At the top is a high-level overview, and tapping any data point reveals more granular detail. As I scroll down, the view moves from today toward trends over time.
Readings by system: the overview first, detail one tap down.
Two levels of fidelity.
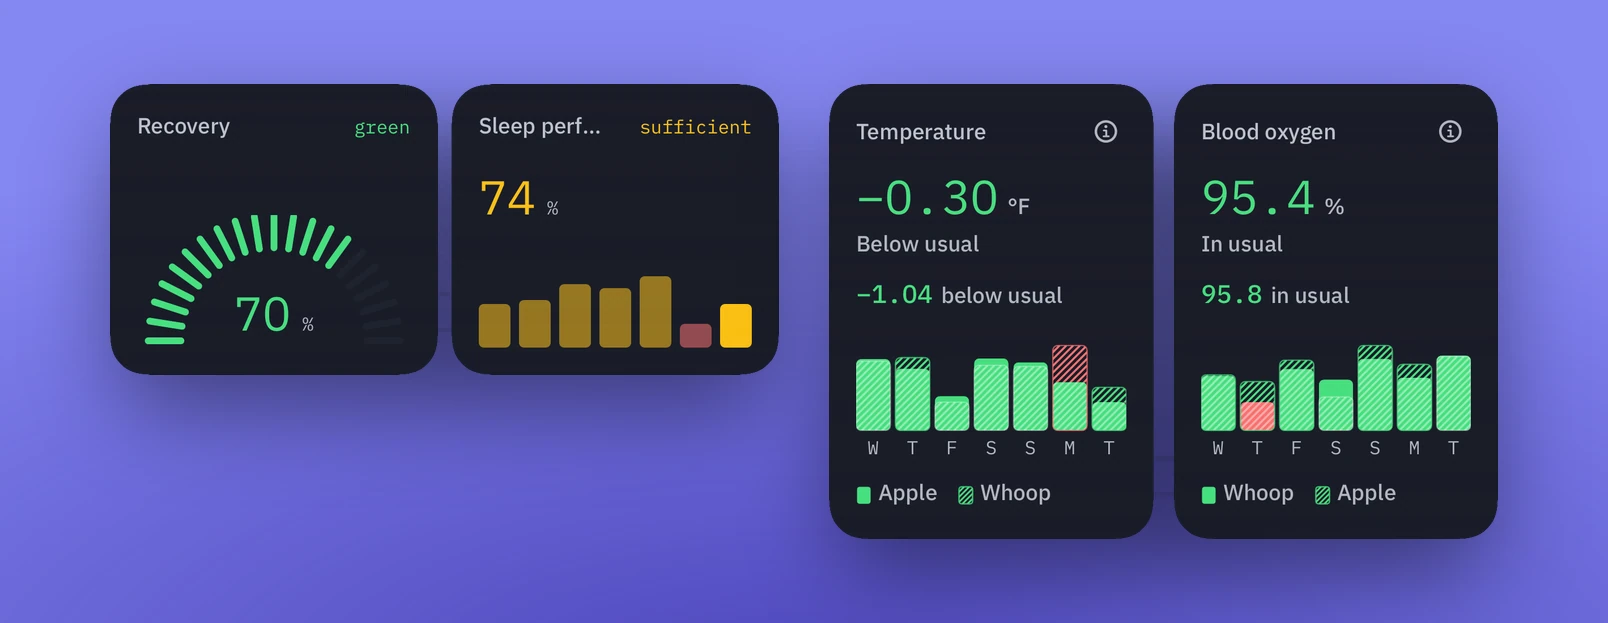
Each data point first appears as a quick visual: a sparkline or graph using red, amber and green colors. It places today's value in context with my norm, or shows that it falls outside it. Because I'm often listening while I glance at the screen, it has to be easy to scan. Sparklines are instantly recognizable, whether they're green, amber or red, and whether they're trending up or down.
First fidelity: a glance. Recovery, sleep, and where each sits against my usual.
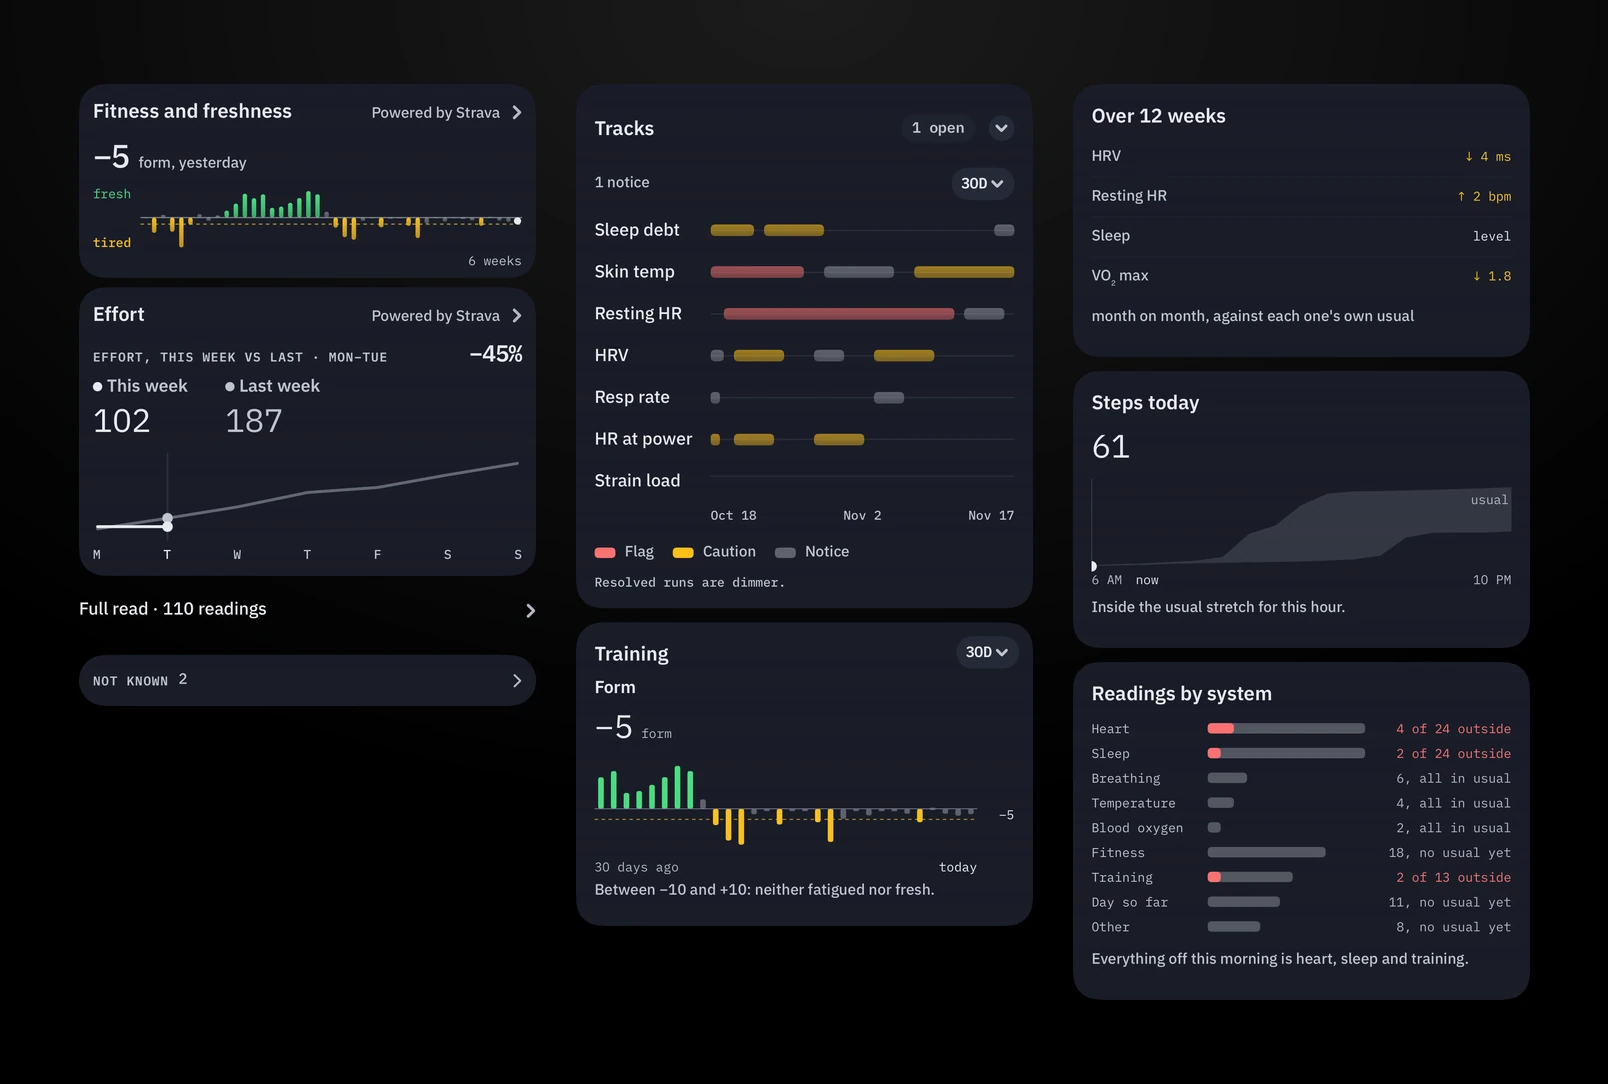
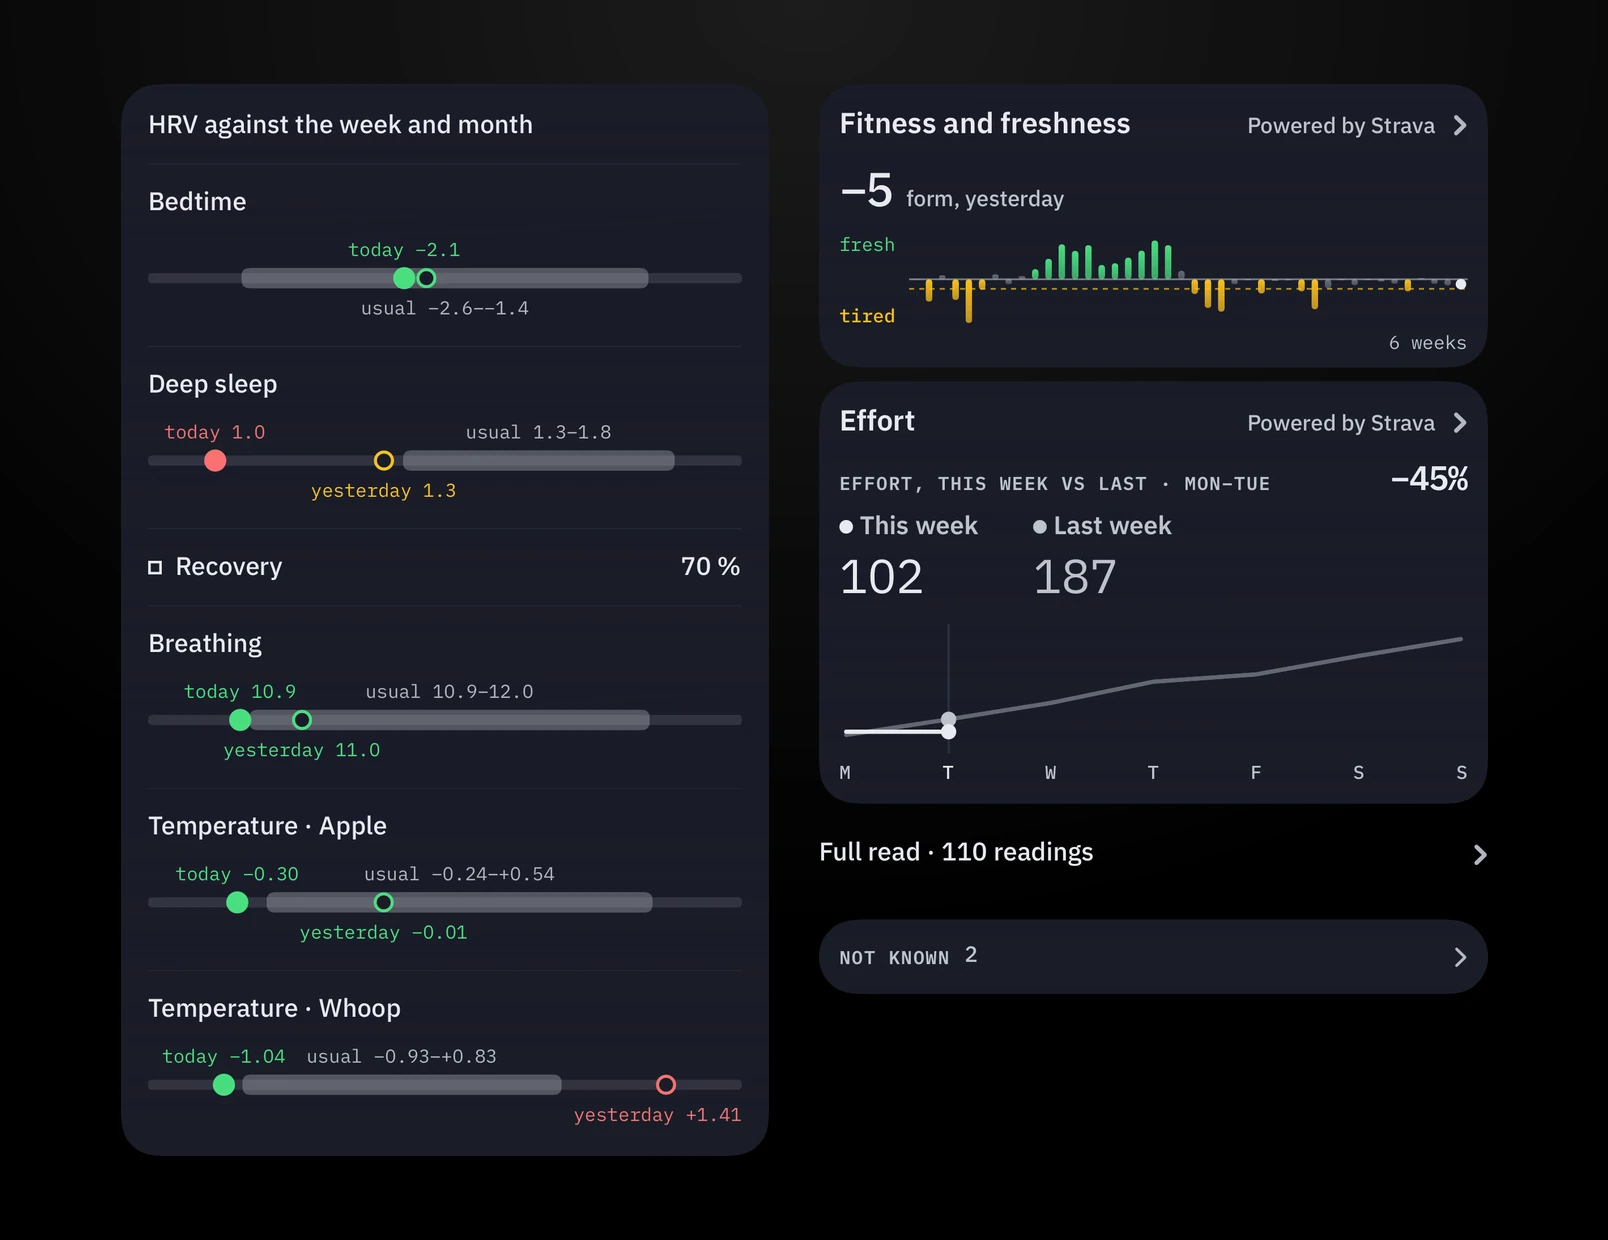
Tapping in places almost every data point in the context of the week, month and year, along with a plain-English reading of today's value.
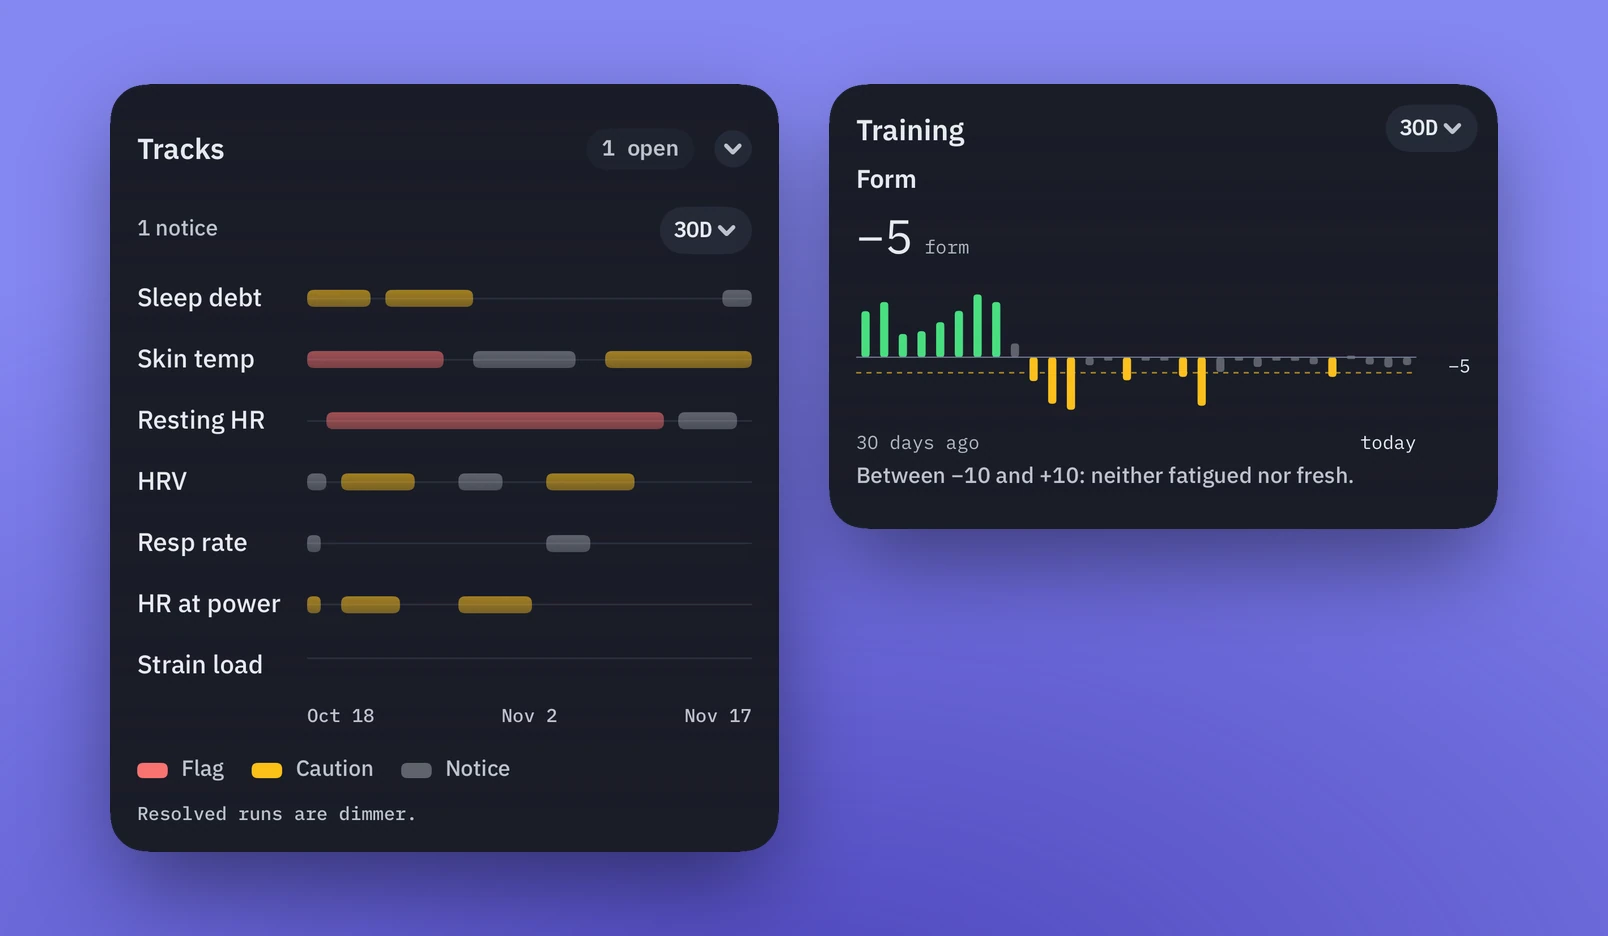
Second fidelity: one reading against the week and the month.Over time: tracks that open, resolve, and how long each lasted.
A conversation with the data
The chat interface is designed to be both conversational and informative. It's there to encourage me to ask questions of the data.
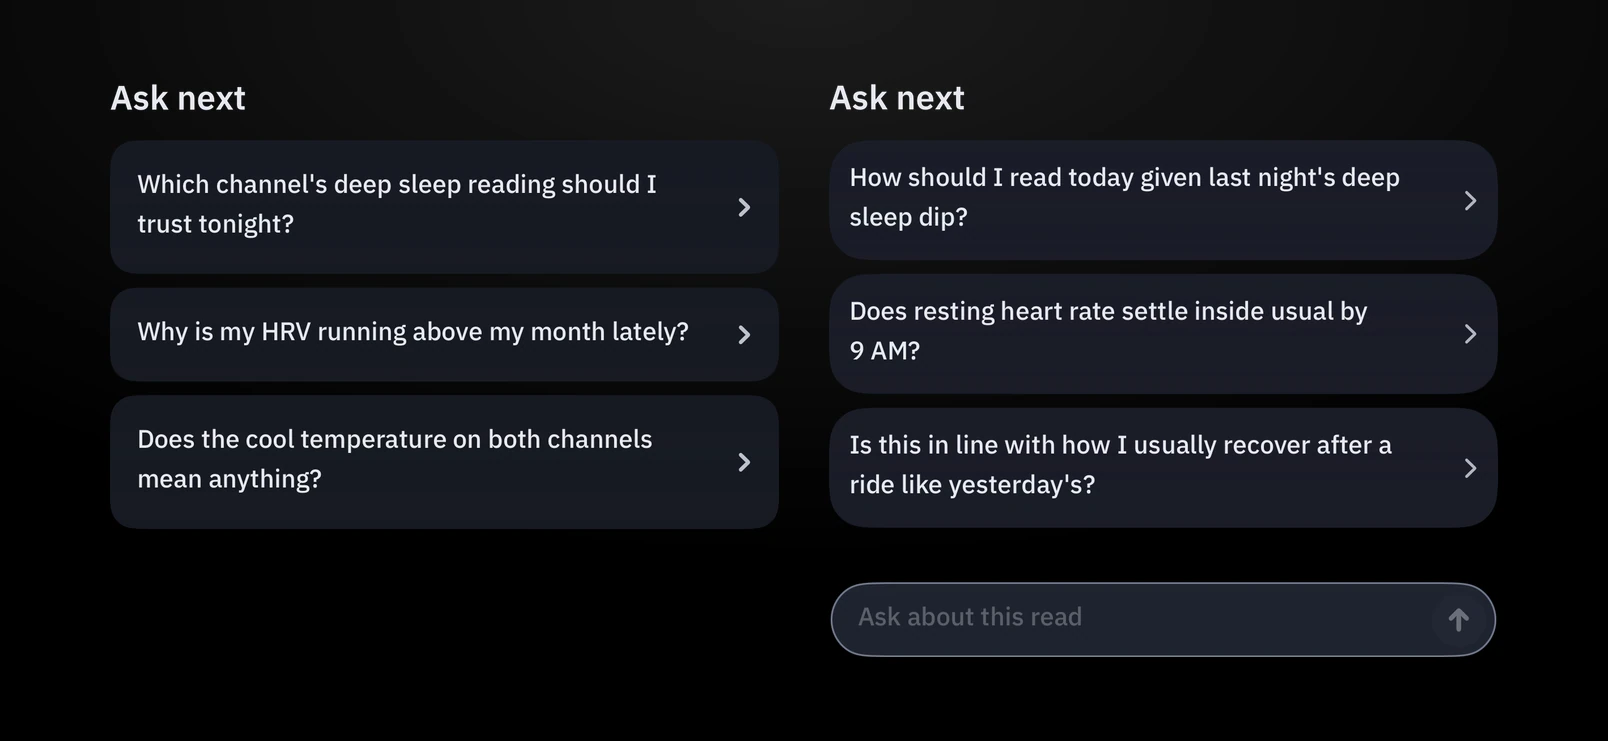
Suggested questions, and a box for my own.
That's why the chat evolved from an optional extra into the entry point. It could be more dynamic in how it analyzed the data. Now it's the first thing that loads, with a quick visual of the sourced data. If something triggers a question, I can ask it right away, even if the suggested prompts aren't what's on my mind.
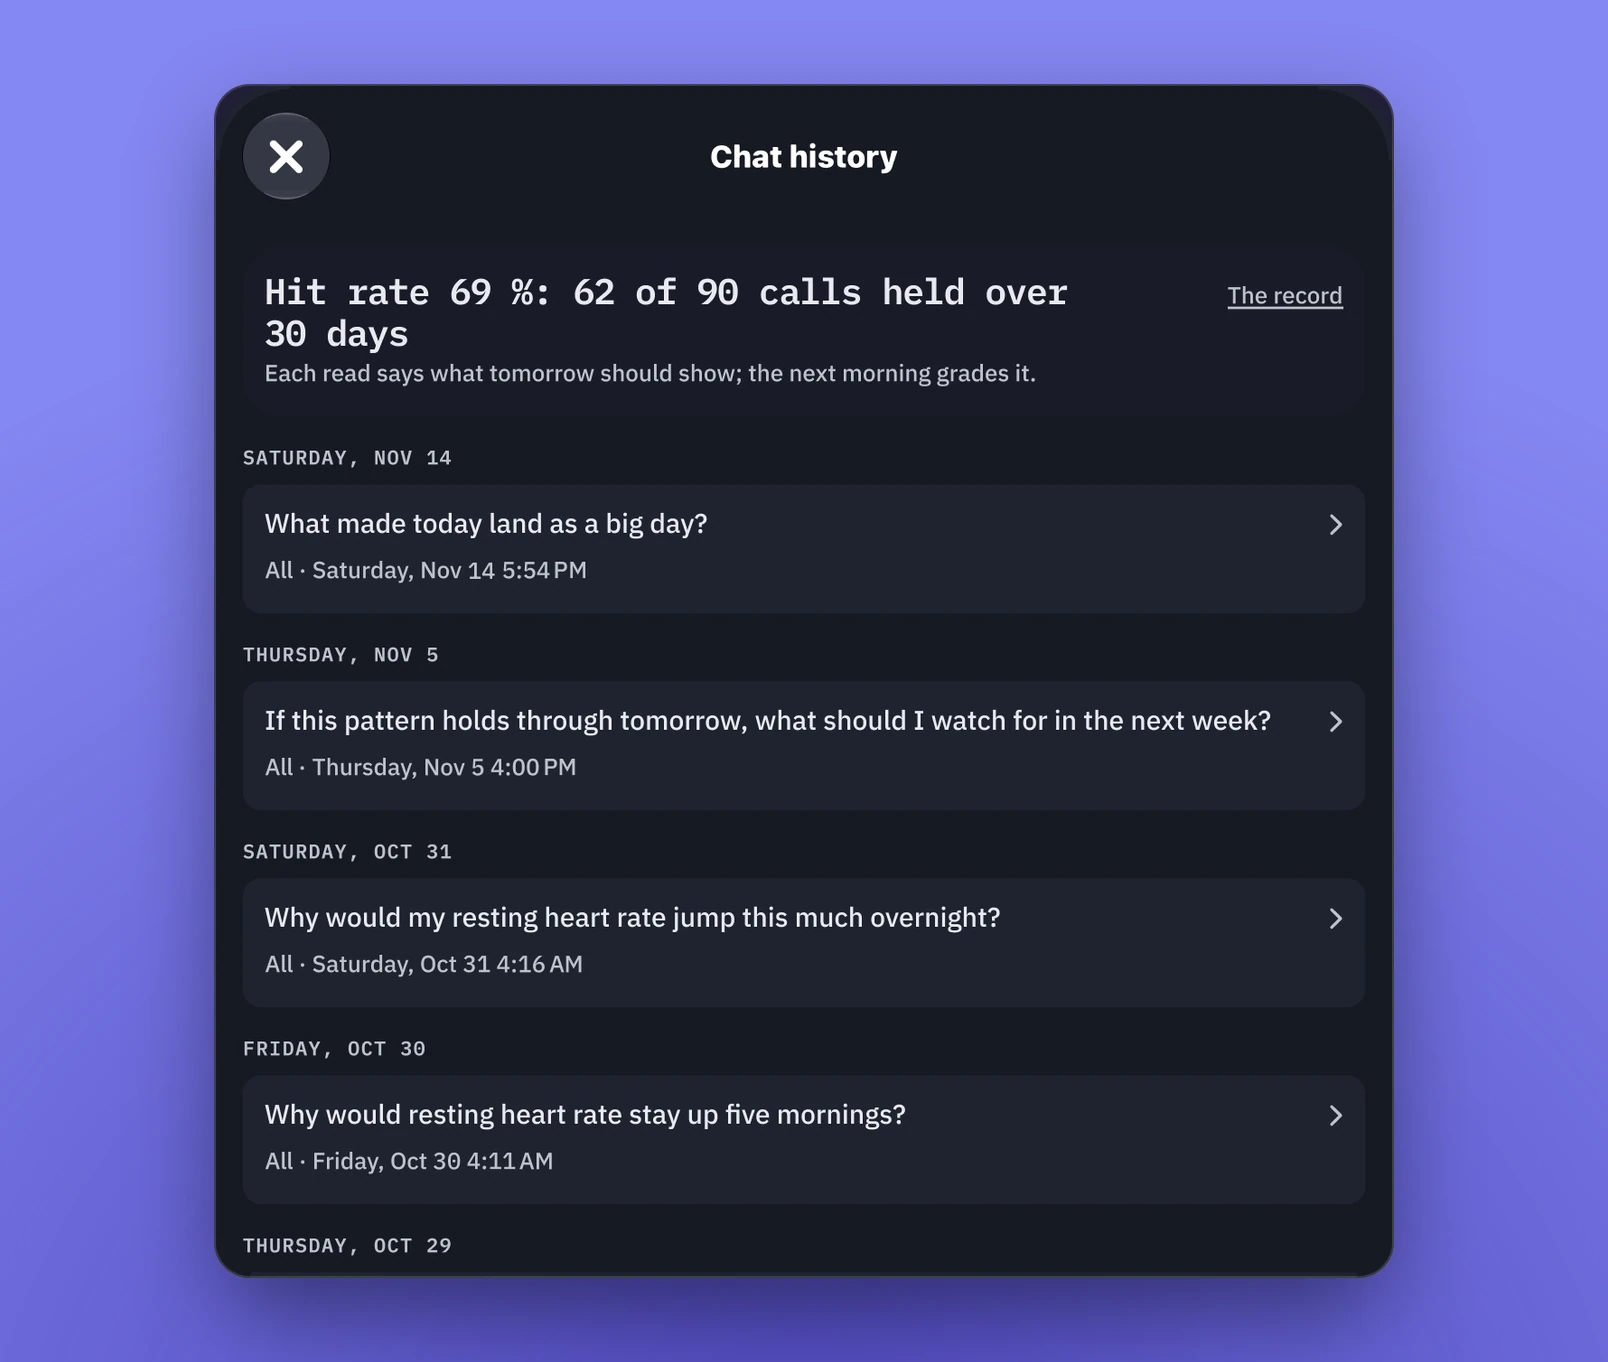
Chat is the entry point; earlier conversations are one tap away.
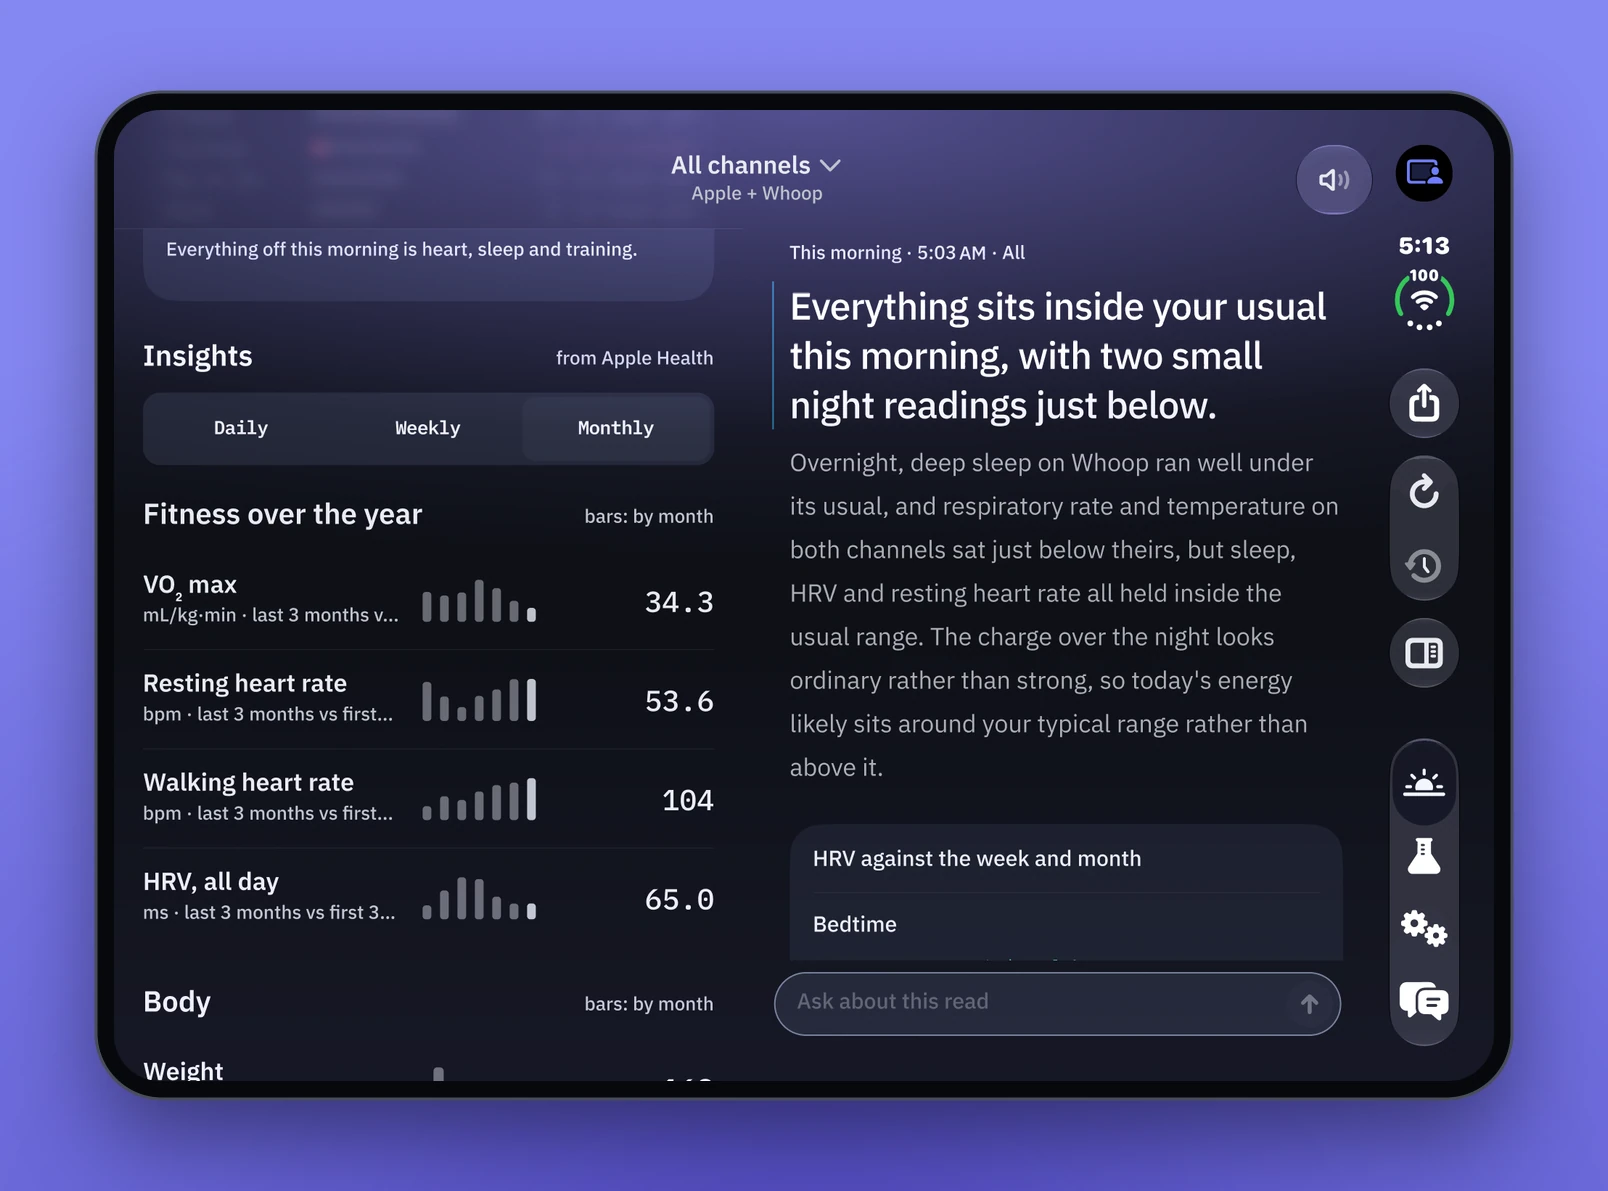
Each screen is meant to be read on its own, but in landscape mode the two come together: the dashboard on the left, the chat on the right. When the data highlights something I want to understand better, this gives me a clear way to have a conversation with it.
Landscape: the dashboard and the conversation side by side.
That's what Signal gives me: control over how my data becomes information, and a way to learn about AI through numbers I already know. What started as every imaginable data point became a conversation about how my body is doing.
An app for an audience of one. Every ride is a round of user testing, and every ride that breaks down is a bug report.
The app is the product, I'm the only user, and every ride is a round of user testing. When a ride breaks down, I trace what the AI logic missed and fix it. The rules evolve, and they need fixing less and less.
A tool for my week
The whole point of HRV Ride is to help me improve my HRV and my FTP.
It started with a time problem. I was using Claude to give me a set of weekly routes, then building each one by hand in Zwift. That took upwards of 90 minutes, and the workouts didn't take my HRV into account. Building a route in Zwift's UI is slow when there are a lot of over-unders or blocks at different watts and cadences. A basic, blocky workout takes 5 to 10 minutes, and considerably more when there are lots of changing elements. If I had to keep doing that, the whole idea wouldn't be sustainable for my sanity or my time.
So I built HRV Ride with Claude Code. The first version was simple: a UI that kept track of my week ahead and created the workouts to upload to Zwift. This was one of the few apps I designed primarily for the Mac instead of my iPhone, because the Zwift file has to go through my computer.
Now, once I know my ride, HRV Ride creates the custom route for me. I download the Zwift file and import it into my Zwift account.
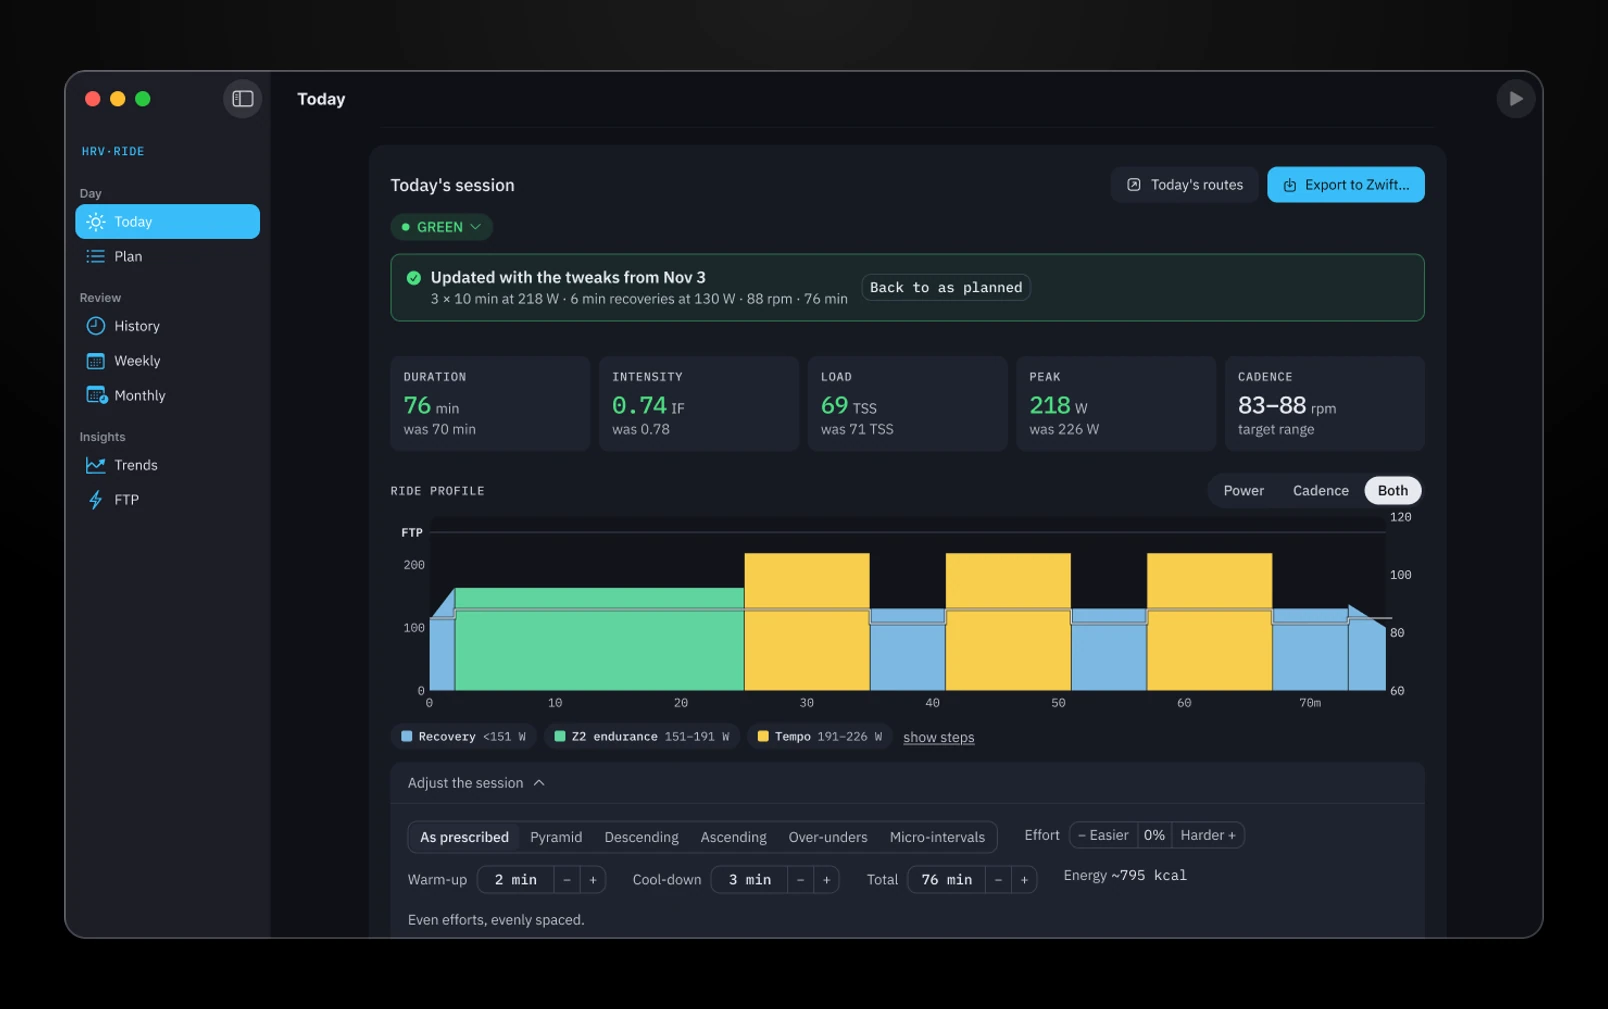
Today’s session, built and ready to export to Zwift.
The first plan was simple too. My HRV score picked a hard, medium or easy ride, and the hard days rotated through RUTT intervals every four weeks.
HRV picks the day: green, amber or red.
Every morning, a new iteration
Over time, the app evolved from a weekly tracker into something that read my HRV data and made the workouts dynamic. That in turn had me adjusting the UI almost every morning, for weeks on end. Each morning I made a couple of tweaks to the UI or the flow. Most were small iterations and experiments: adding and removing data, graphing the workout, making the workout easier to tweak, and tuning how the AI recommends it. All of that shaped what the UI shows from the data and the analysis.
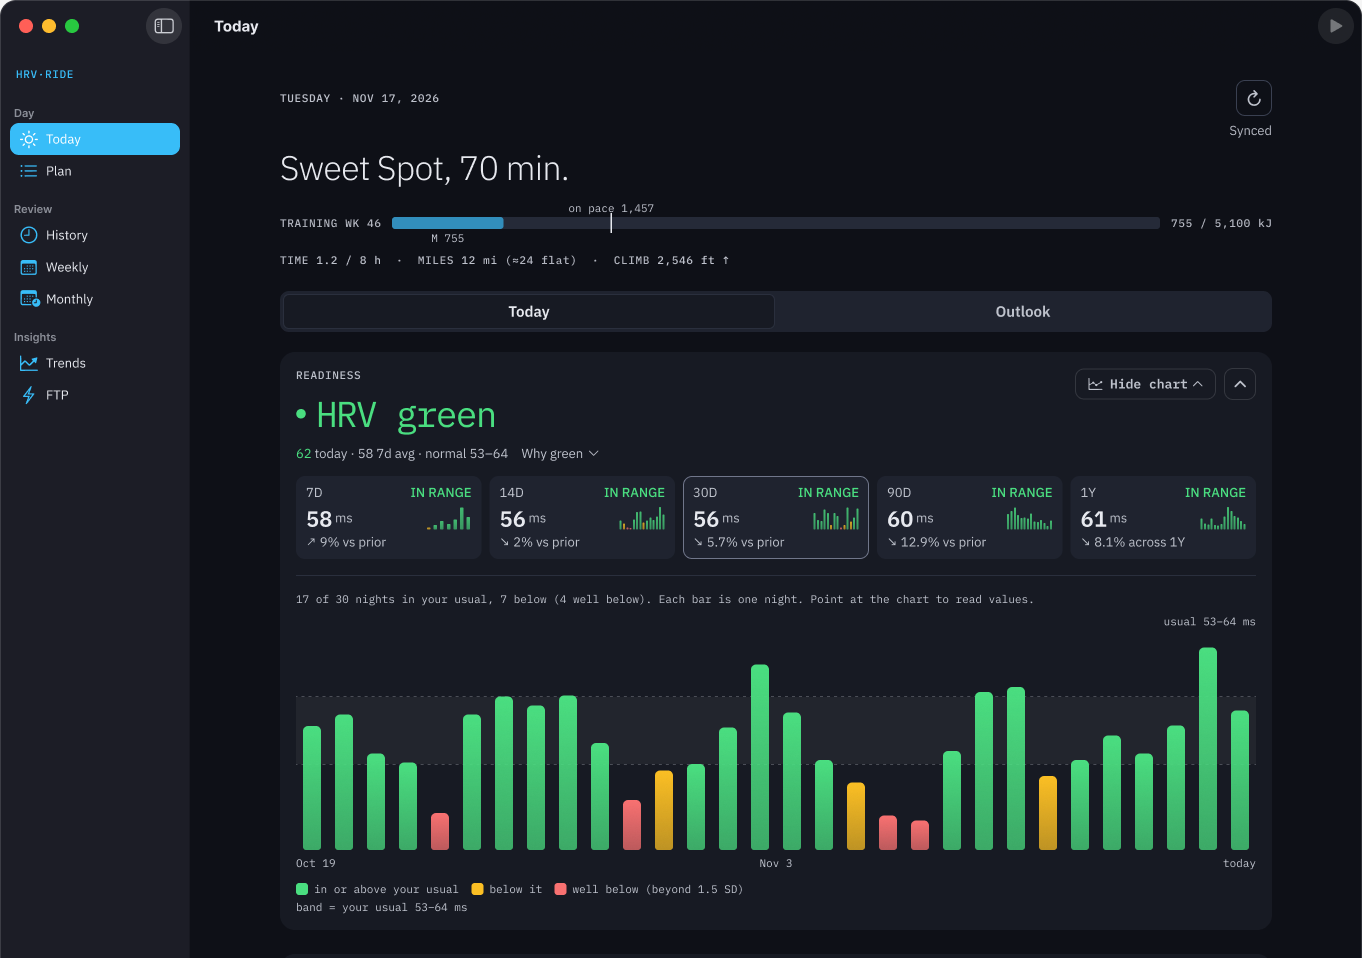
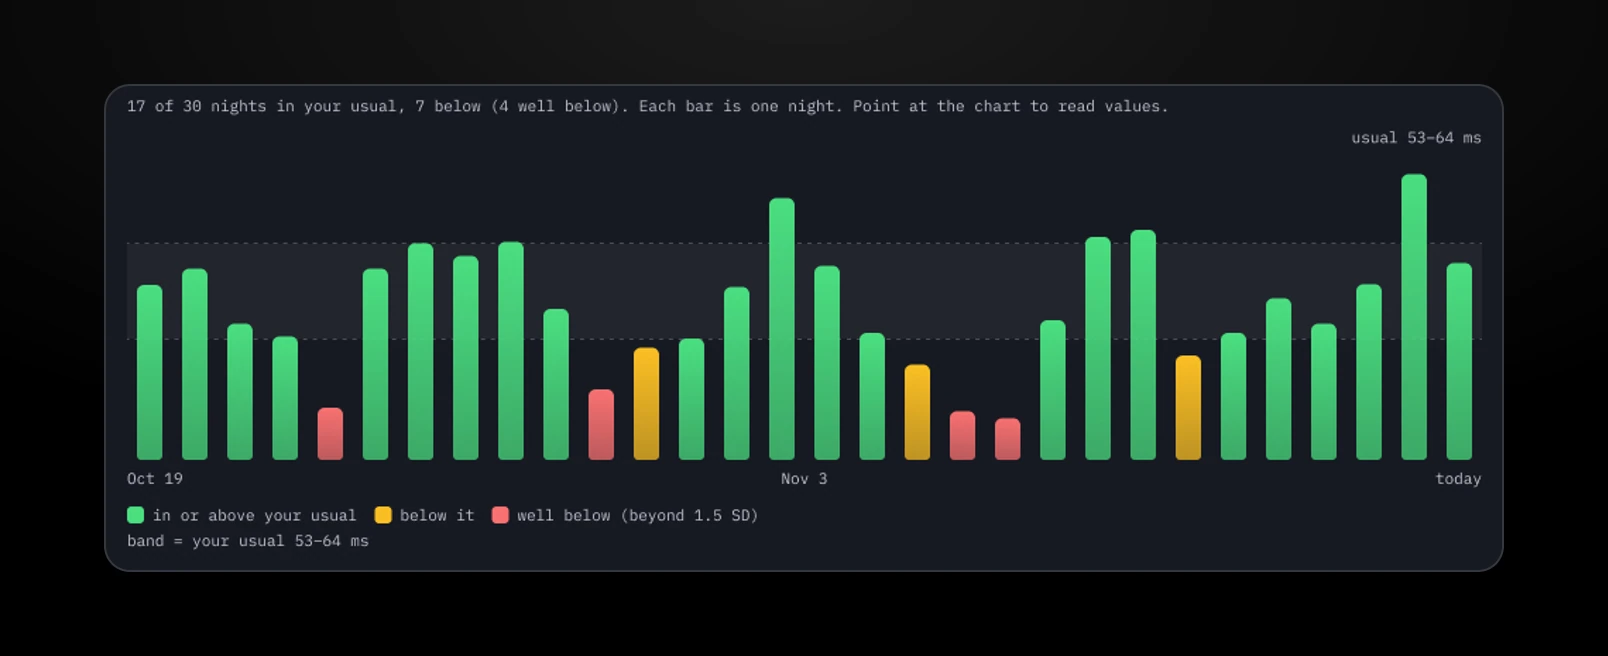
The red, amber and green (RAG) score was one of the key design decisions. It's an easy way to keep track of where my fitness is at, though I can see the colors evolving over time. Green means my fitness is in optimal shape, so the workout is going to be quite challenging. Amber is about maintaining my current fitness without burning my engine. Red means my engine needs a real slowdown to recover.
Thirty nights of HRV: green in or above my usual, amber below it, red well below.
The score comes from data HRV Ride pulls in from Apple and Whoop. The workout is then determined by the score and by what I'd typically do on that specific day. Each day of the week is part of a bigger system, and each week is part of a monthly program. So each month is broken down into weeks, each week into days, and each day is shaped by the HRV score. Green is an all-out kind of day, broken into segments that match what my optimum should be. If it's amber or red, the same workout is turned down to match the color.
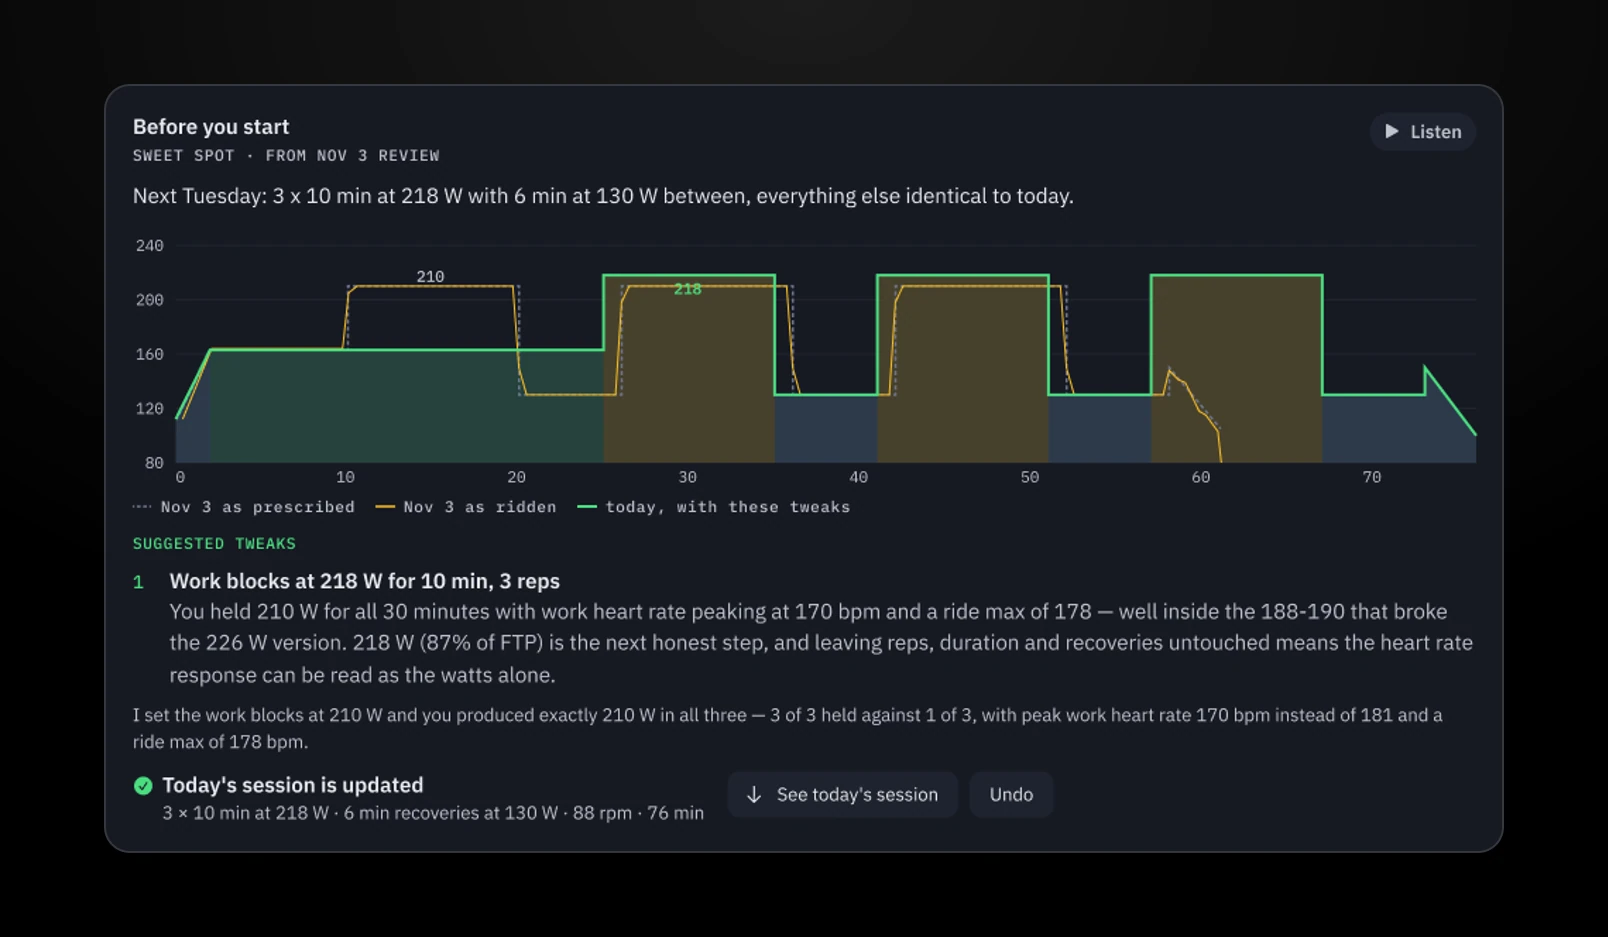
Once the HRV score comes in, the AI takes it along with what's scheduled for today and tweaks the workout for my body. Its main focus is keeping me from burning out. It evaluates what I did the previous week, and how I did in similar conditions. For example, a green day last week may have called for a workout that was too strong and overworked me. The app knows to break down certain segments this time to keep my exertion at a sustainable level.
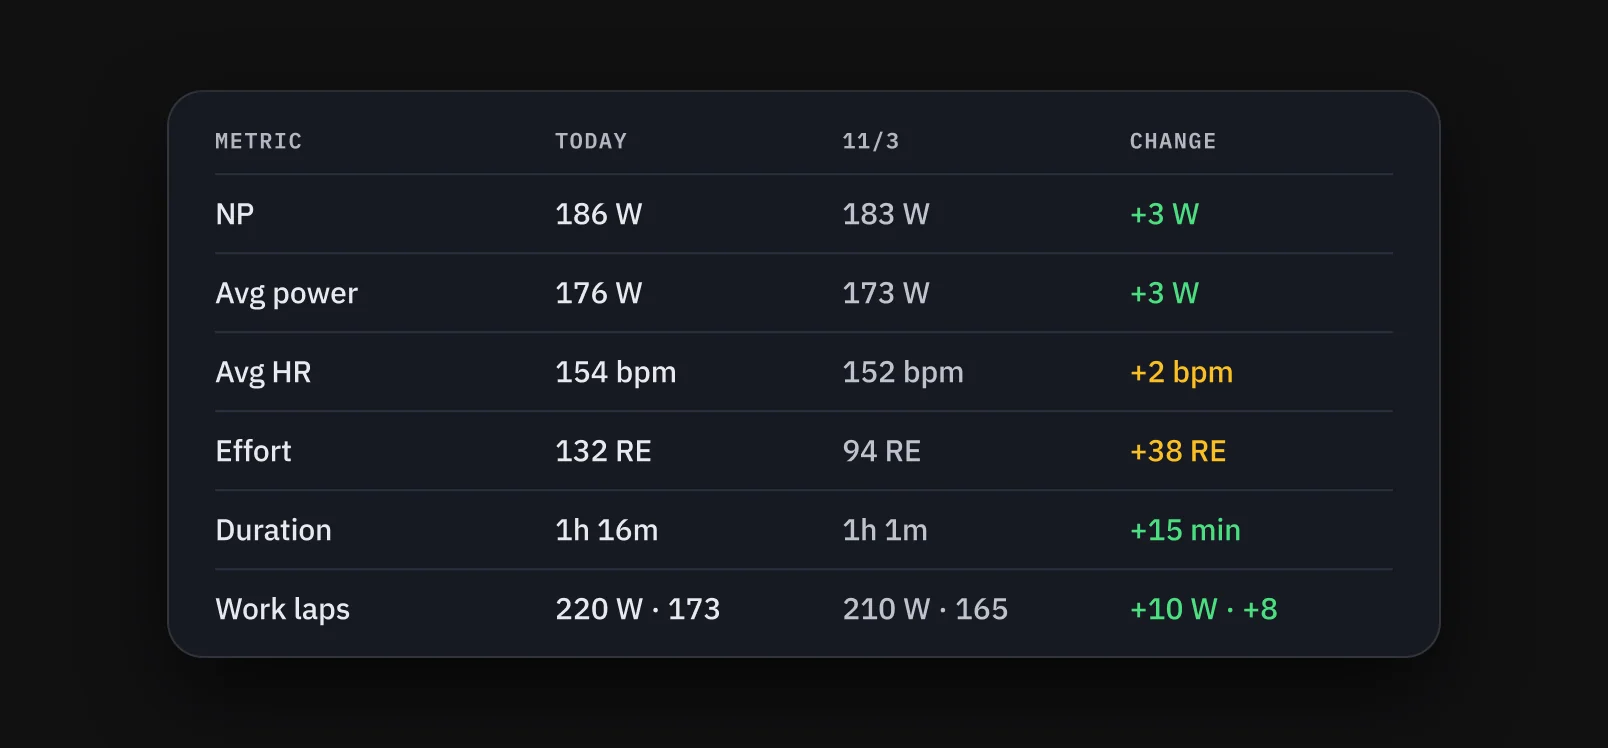
Before the ride: last week as prescribed, as ridden, and today with the tweaks.
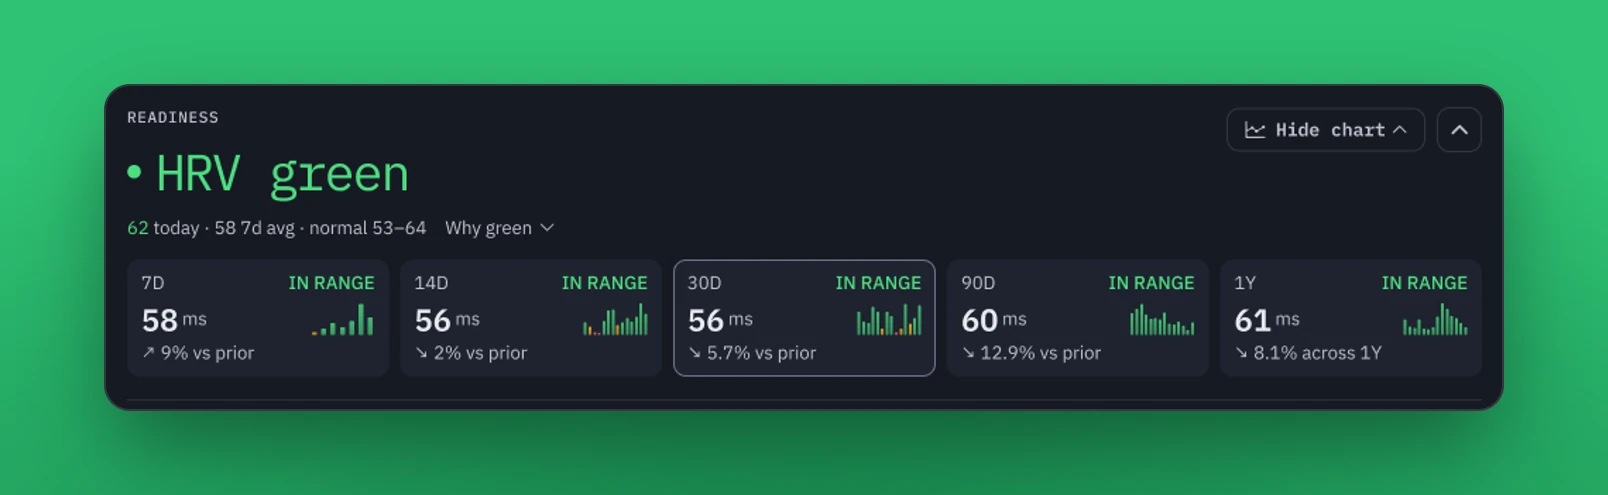
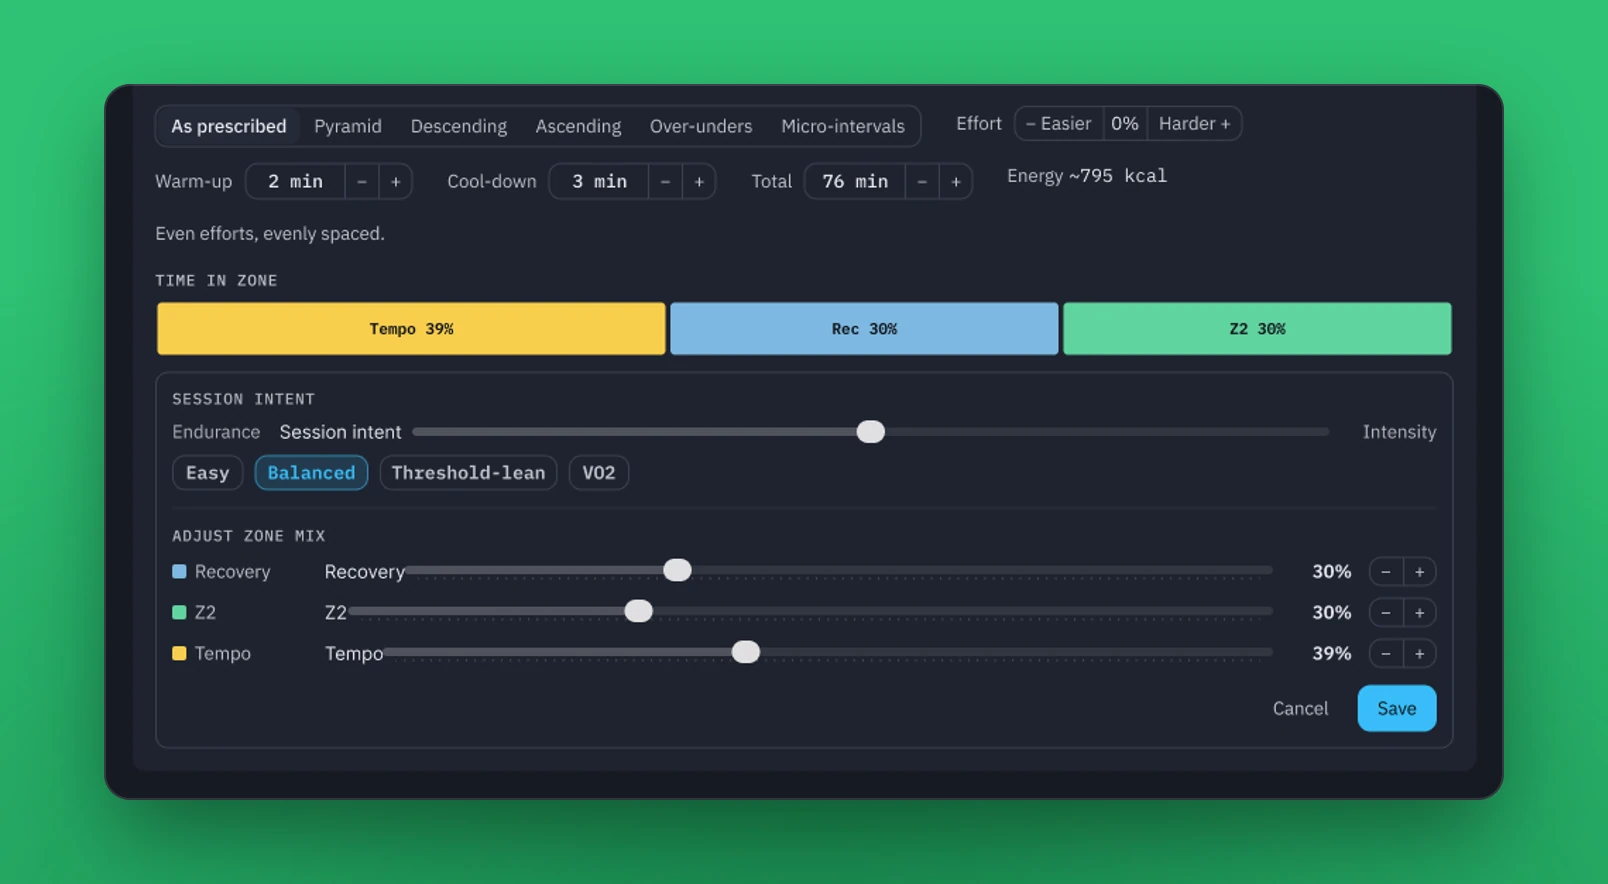
The daily view shows how my HRV is trending across a couple of different time ranges, along with the block workout I should do. It suggests bigger tweaks if my HRV is in the amber or red. I can customize the workout too, whether that's tweaking a single data point or reducing the intensity by 10%.
Adjust the session: intent, effort, and the zone mix, down to a single block.
Each day also fits into a bigger picture, and time is what ties the week together. Weekends are much longer rides, and I need one day for rest and recovery. The other days account for how recovered my body is and what's coming up. Monday used to be my recovery day after the long weekend rides. I recently changed that to build more fitness: now Friday is a lighter recovery ride before the weekend, and Monday is a regular day with an eye on my HRV, which can lighten the load if I really need it.
Testing surfaced problems the first design missed.
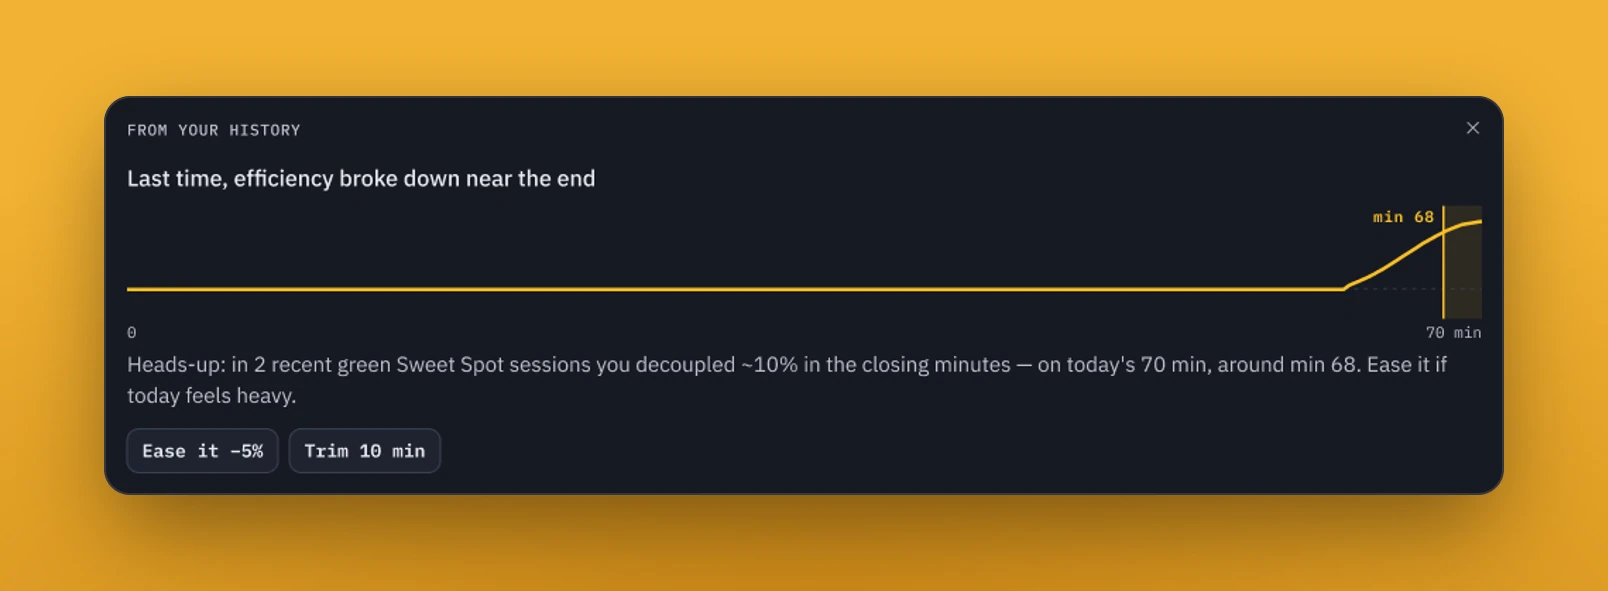
The workouts weren't taking the previous day's recommendation, or how my body reacted to it, into account. Cadence was an issue too: a block might call for zone 2 or 3, but a high cadence was pushing me into zone 3 or 4. So I added rules for both, plus a visual that shows where my workout broke down last time and gives me options to tweak the ride's levels if I think the next one will cause trouble.
Where the last one broke down, and two ways to ease it.
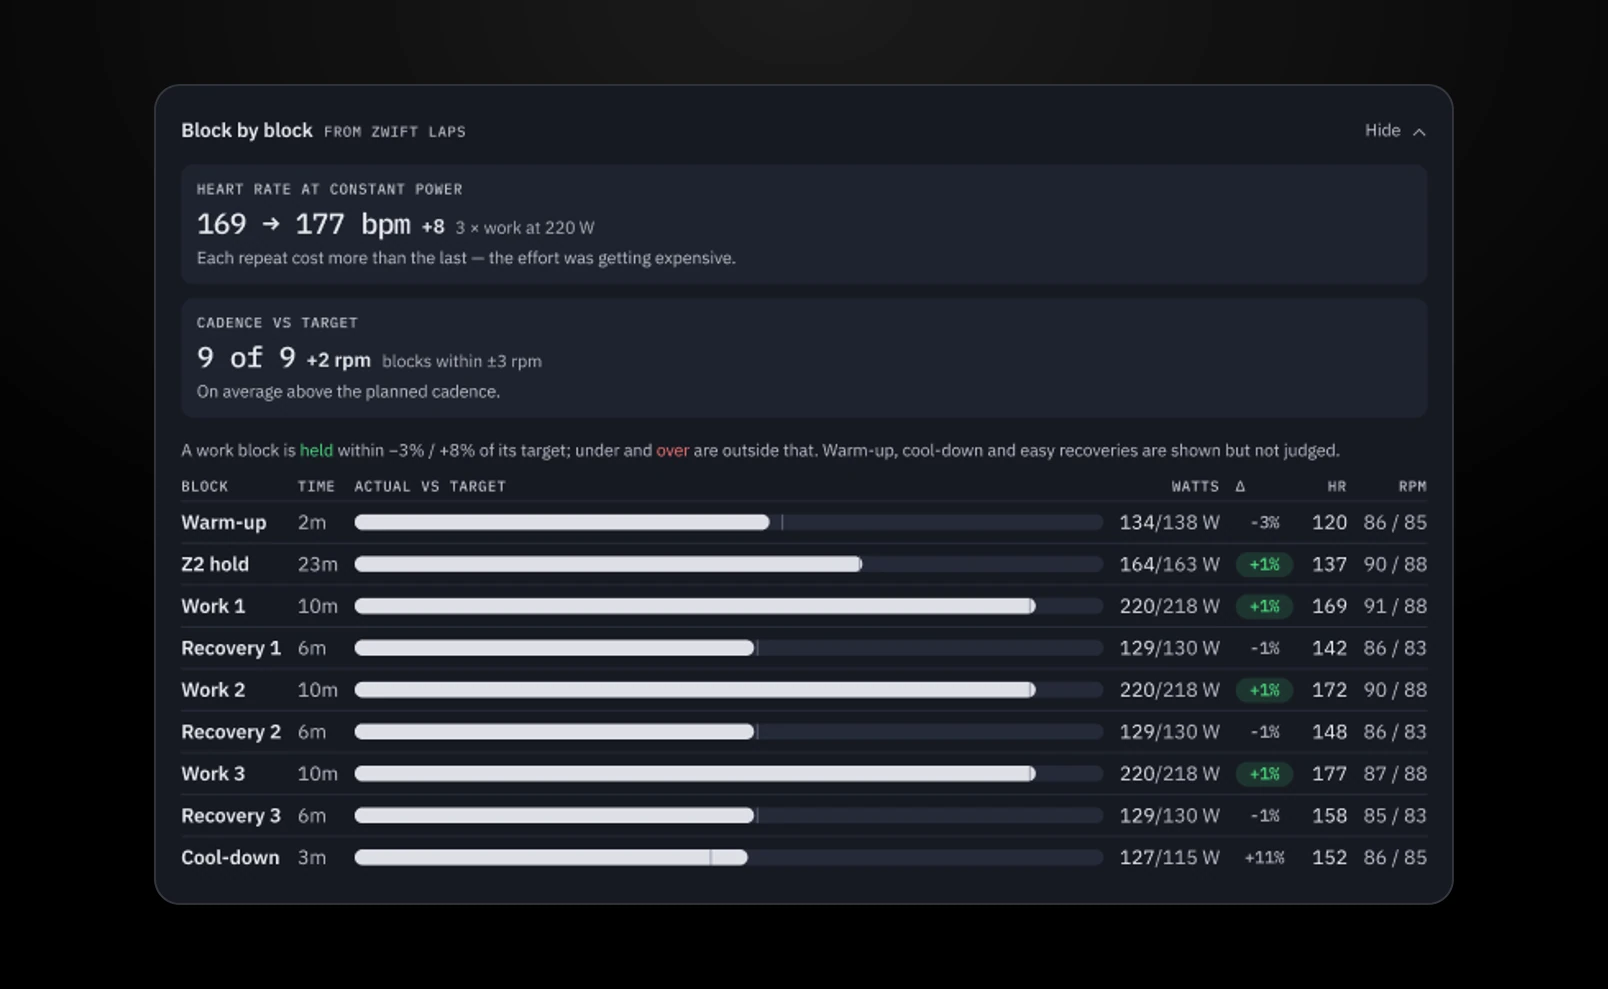
I also had AI analyze my rides to check the plan itself. The first review showed I'd ridden eight straight weeks with no easy week and burned out, so every fourth week became a recovery week. The next review went block by block. I hit the short RUTT efforts six times out of six, but missed 200 watts for five minutes three times out of five. Short, hard efforts were never my problem. Holding power for a long time was.
Block by block: what held, and what it cost.
Every broken ride is a bug report
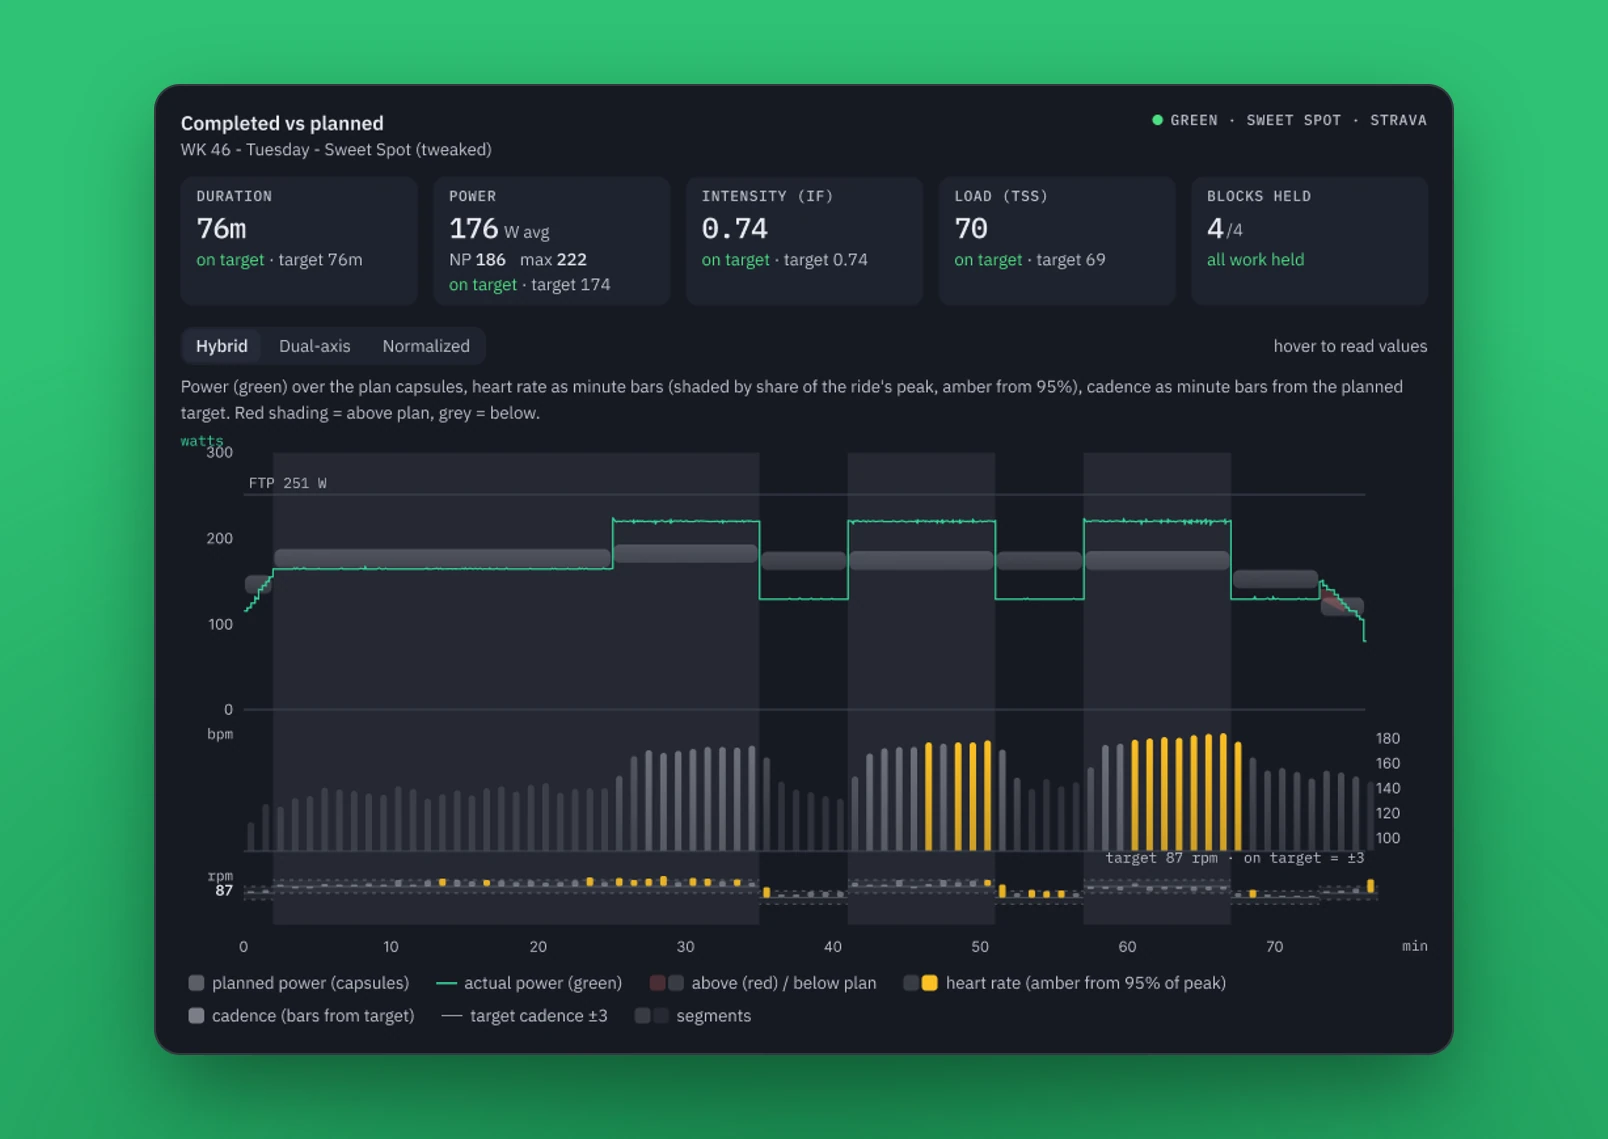
After a ride, I compare my workout with the original design. When the ride goes as planned, there isn't much to notice. Typically I can ride the full workout without needing to negotiate a slowdown. Holding zone 3 or 4 for the set period is no problem.
After the ride: what I planned against what I rode.Power over the plan, with heart rate and cadence beneath.
When I have to drop from zone 4 to zone 1 and back just to get my heart rate to a manageable rate, I know something has gone wrong with the workout rules. I'm too consistent with my workouts for my body to crash mid-ride. I really shouldn't get caught out needing a break.
Thankfully those rides are rare, and they're usually green days that really pushed me. When it happens, the AI has usually missed something: aspects of my ride the previous week, a high cadence, or other rules from that day. So I go back into the AI logic, find what was missed and teach it to catch that next time. That's when the rules evolve. As I've done that, I've had to reassess the logic less and less.
Those fixes carry forward. If my body is in a similar state to the last time a ride went wrong, the app can tell me ahead of time to take time or effort off.
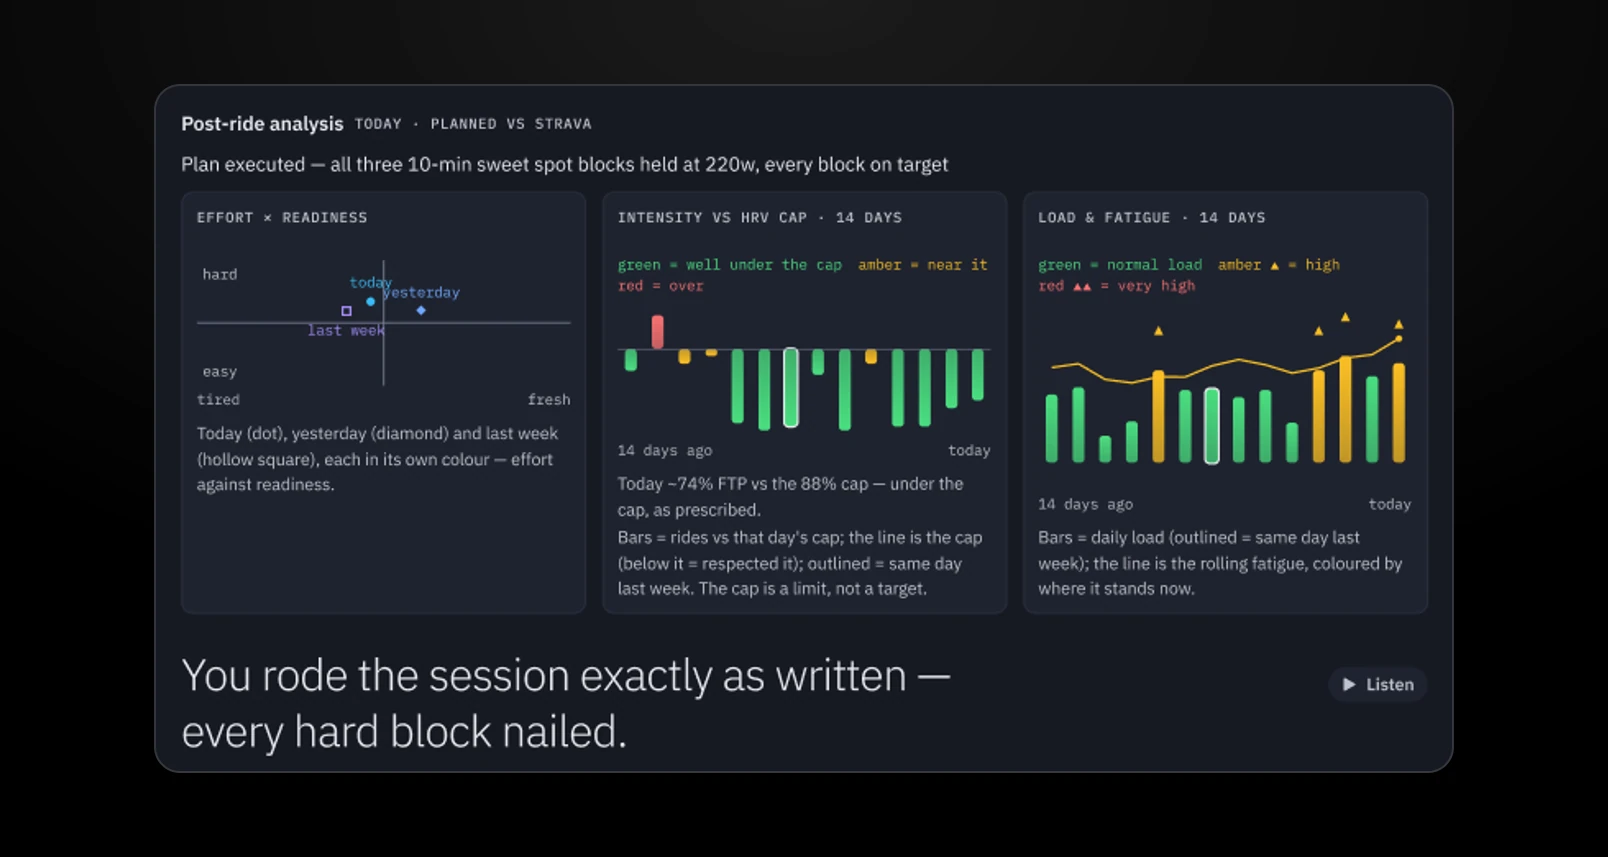
The review, in three charts and one sentence.
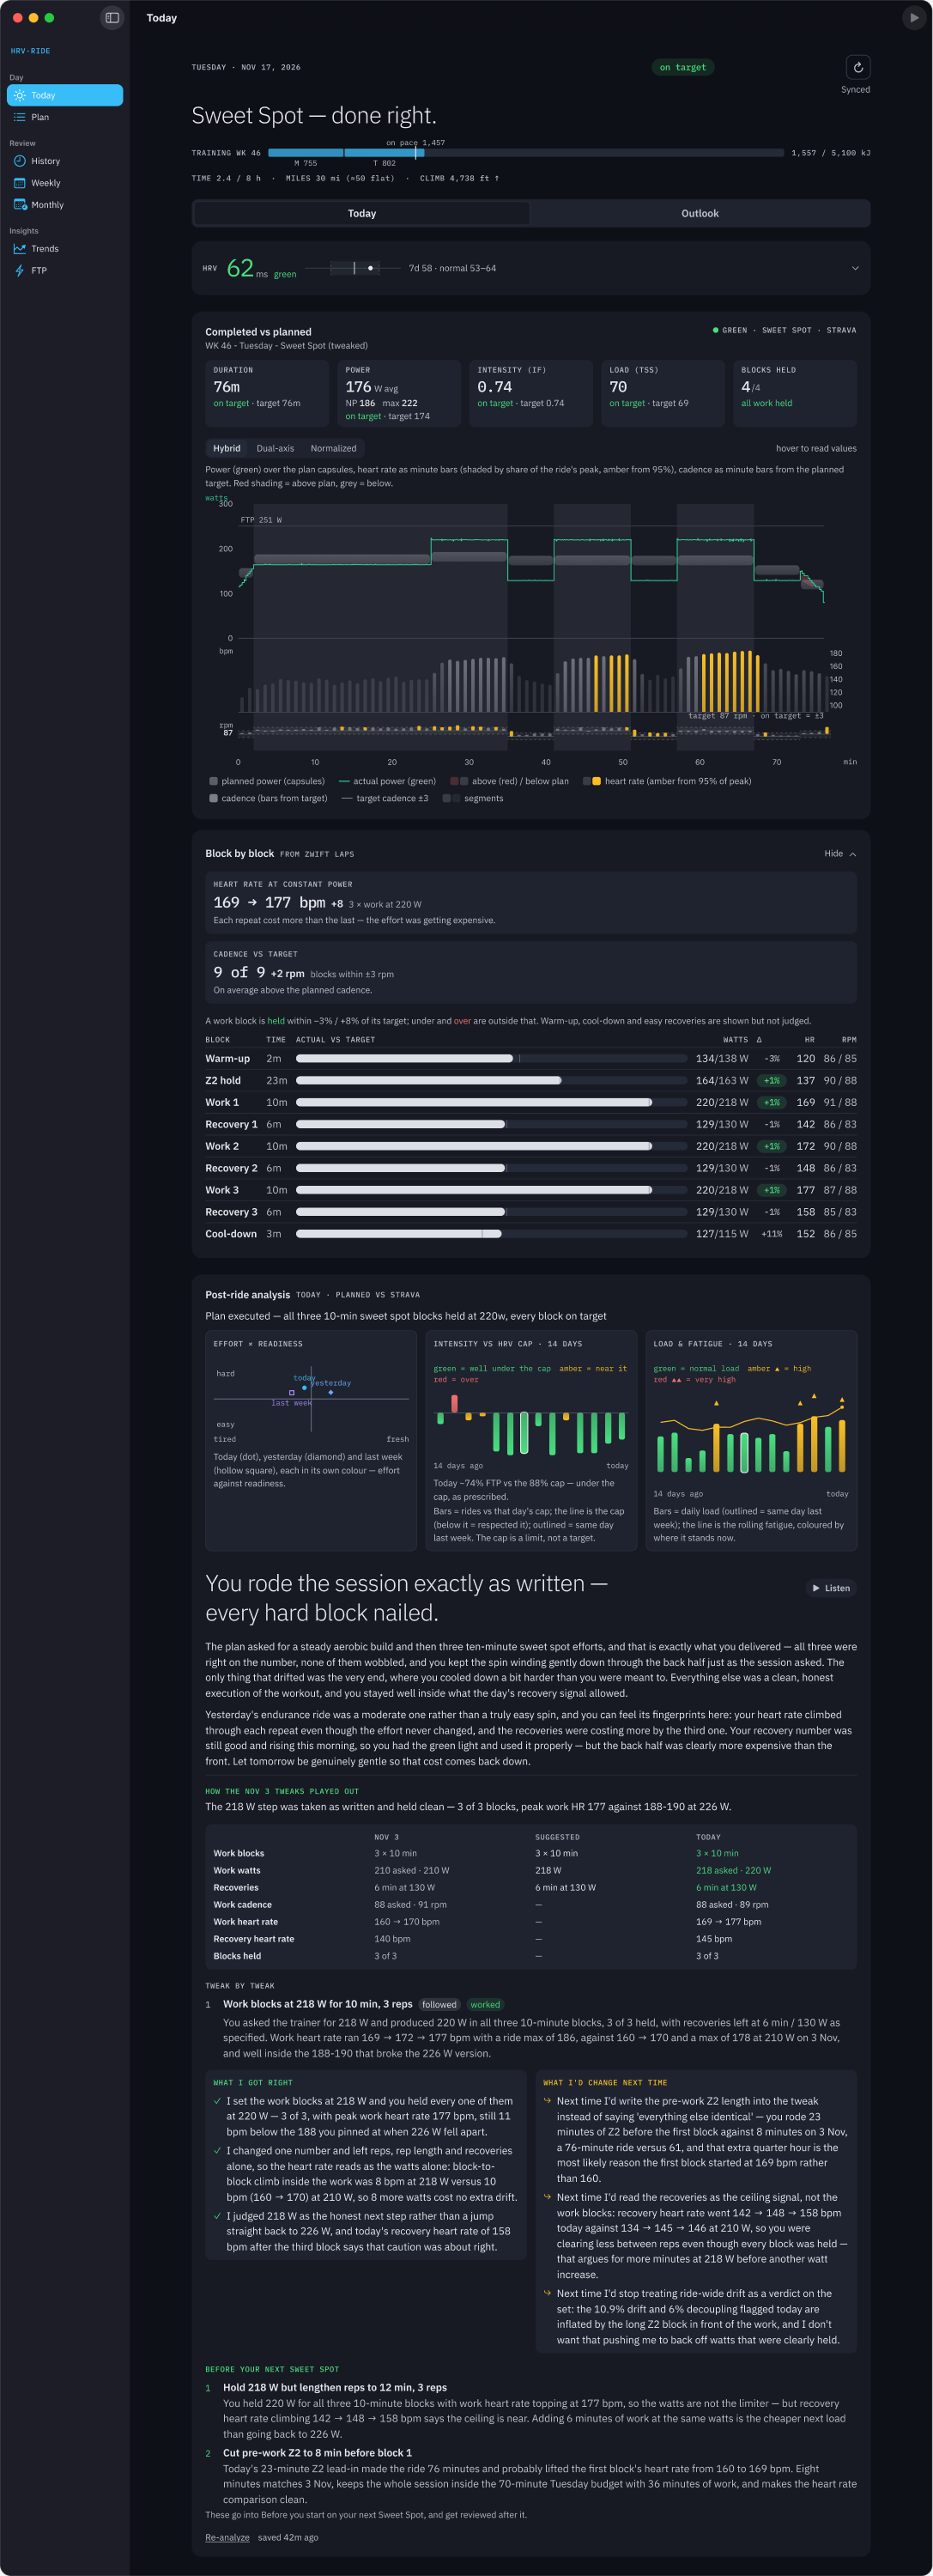
The whole day, after the ride.
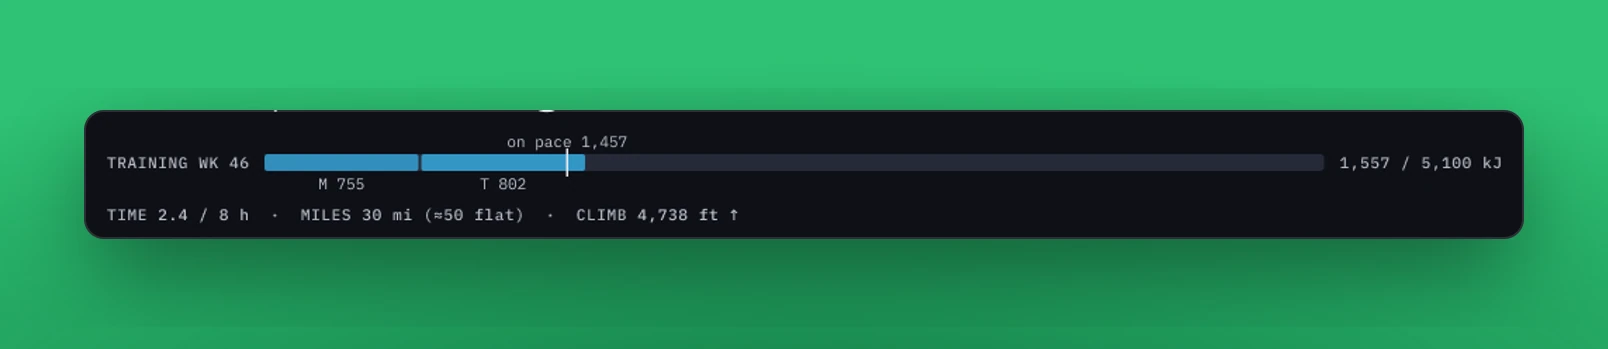
The biggest fix came in October, when I had the AI review the whole year. My plan asked for hard rides Tuesday through Sunday, and my HRV had allowed that 9 times in 50 rides. My FTP had been flat since August. The only stretch where I got better was when I did about three hard rides a week. So I rebuilt the week around three hard days with an easy day on either side: Sweet Spot on Tuesday, RUTT on Thursday and Long Tempo on Saturday. The goal changed from miles to 5,100 kJ, with my riding kept to roughly 8 hours a week.
The week as energy: 5,100 kJ in roughly 8 hours.
The results so far: I'm much more in the green than I was, and when I'm in the red, the app's next-ride recommendations are more likely to get me back to green. My FTP has held steady. At first that surprised me, but I've come to see it as my body regulating instead of burning the engine.
That's what HRV Ride is all about: creating custom rides based on my fitness for that specific day, using today's metrics and my history.
Months of daily iteration turned a dashboard for looking back at rides into one that answers only what I need to know, with little to no effort.
The one-page sheet
Theme: Months of daily iteration turned a dashboard for looking back at rides into one that answers only what I need to know, with little to no effort.
Hero: Me, as both the rider and the designer.
Antagonist: First, the generic AI summary that couldn't tell me how my ride really went. Then, training hard without results. Finally, my own finite attention.
Act One: Strava's summary isn't enough. I start wide, exploring what Strava data I have and how I can visualize it differently, comparing each ride with yesterday, last week and last month.
Act Two: I tweak the app every day. The fitness and freshness graph becomes the one that matters most. But I'm burning my engine without much to show for it. I use AI to study a year of data and build HRV Ride, and Strava's purpose changes.
Act Three: The app now answers three questions after every ride and gives me week, month and year trends without clicking around. I don't study every card, but the visualizations are what make the data feel real.
Starting wide
This was the dashboard that started everything. I wanted to understand how my ride went beyond what Strava's generic AI summary was telling me.
I wanted to place each ride in context with the others. How did it compare with yesterday's ride, or the same day last week? How was it adding to the week and month so far? How did it compare with last week and last month, and how did it fit into the bigger trends for the year?
Each ride against the same day last week.
I started really wide, looking at what Strava data I had and how I could visualize it differently from the Strava app. It became the launching point for many of the questions I would start asking about my health.
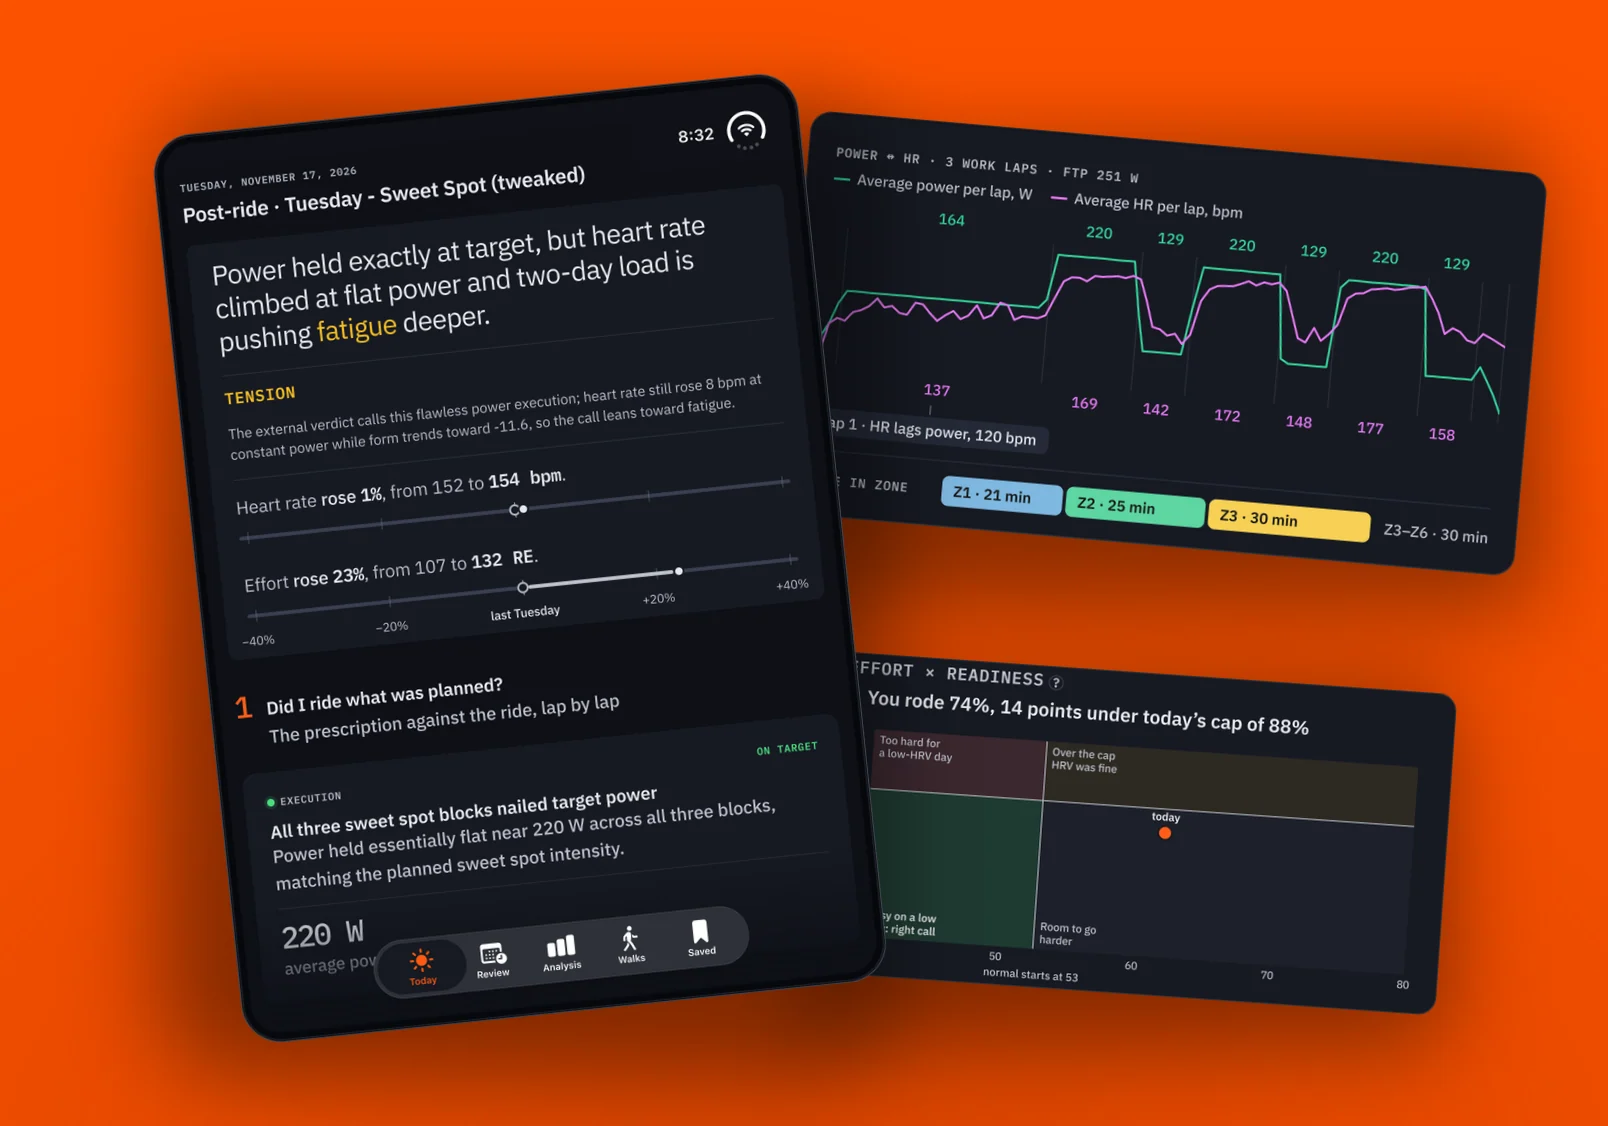
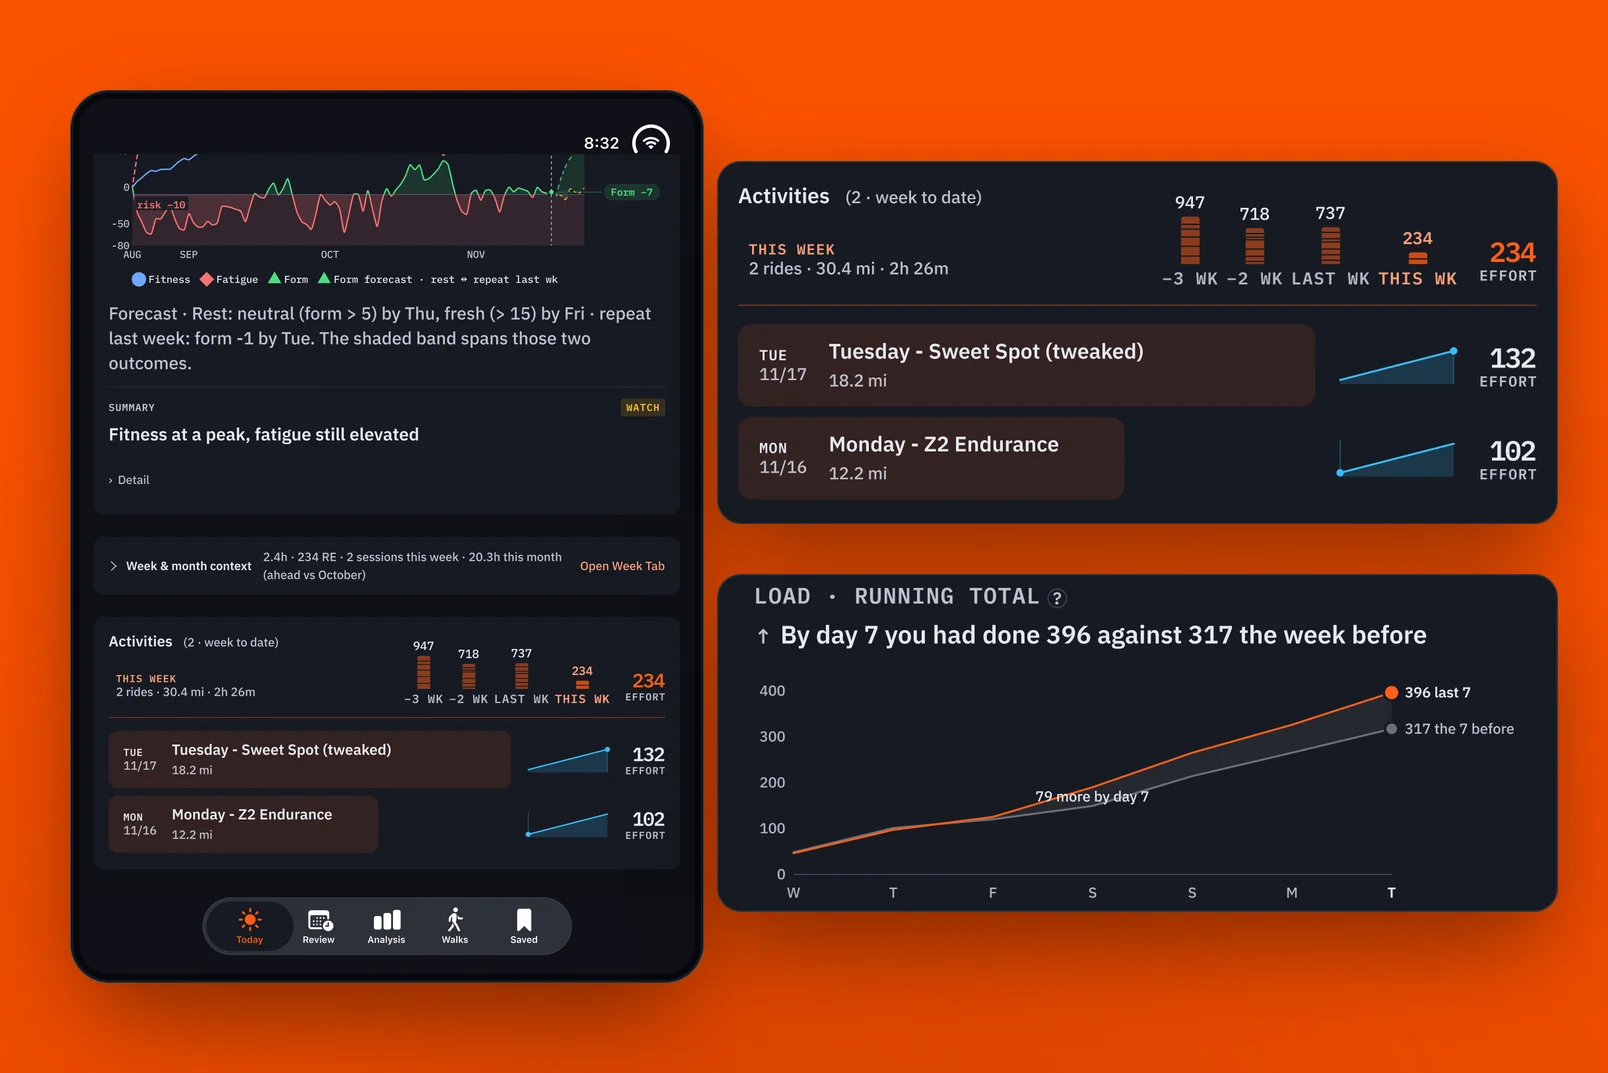
The post-ride read on the iPhone Duo, top to bottom.
Iterating every day
This was a very iterative process. I tweaked the app every day for many months. Each morning I would look at it and decide what was useful for my understanding and what wasn't. Did I really dig into the data? Did I really analyze each day against the last? How could I streamline the things I needed to know without switching between tabs?
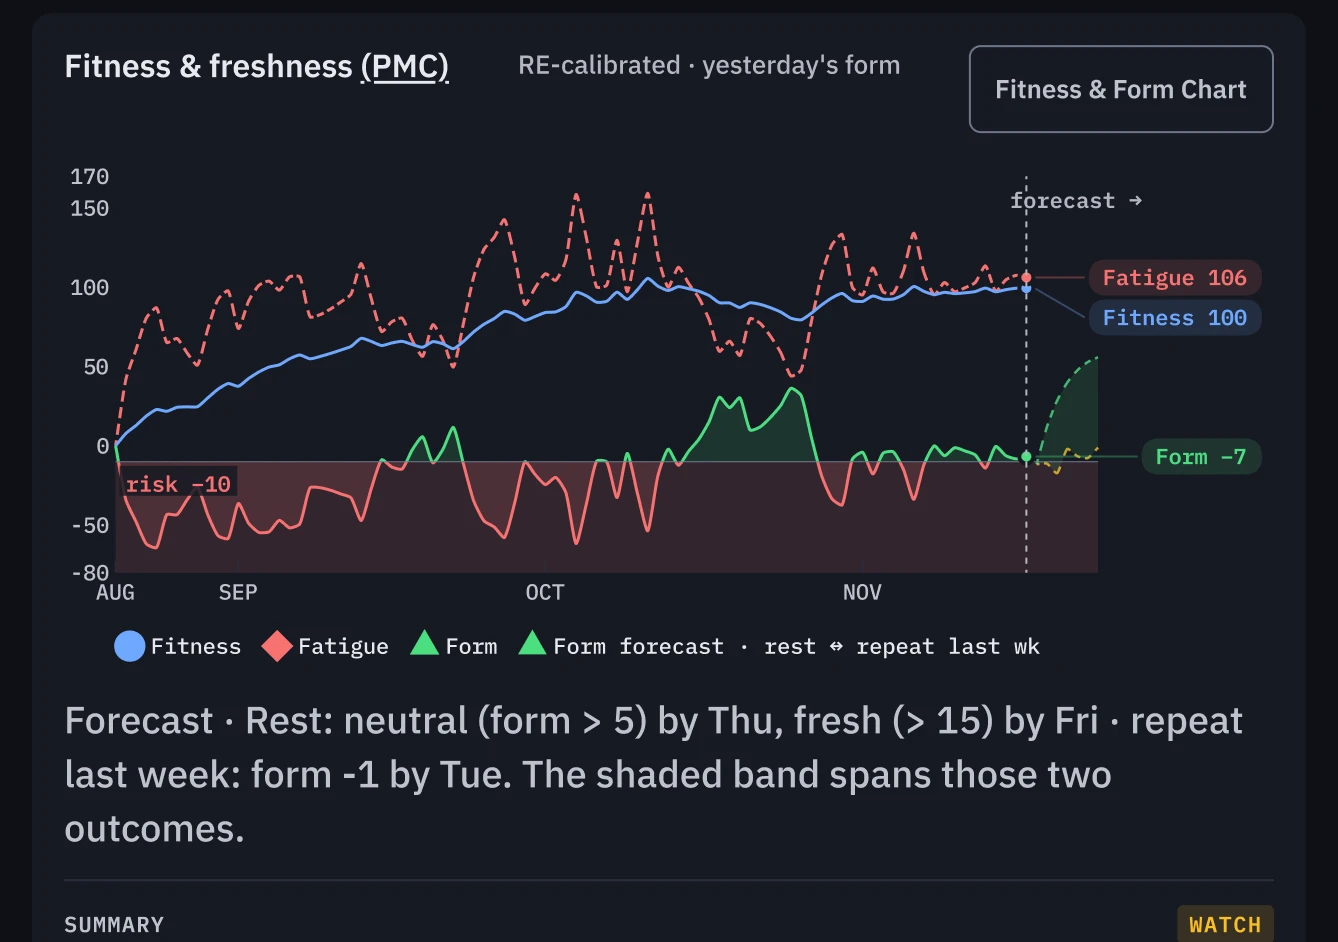
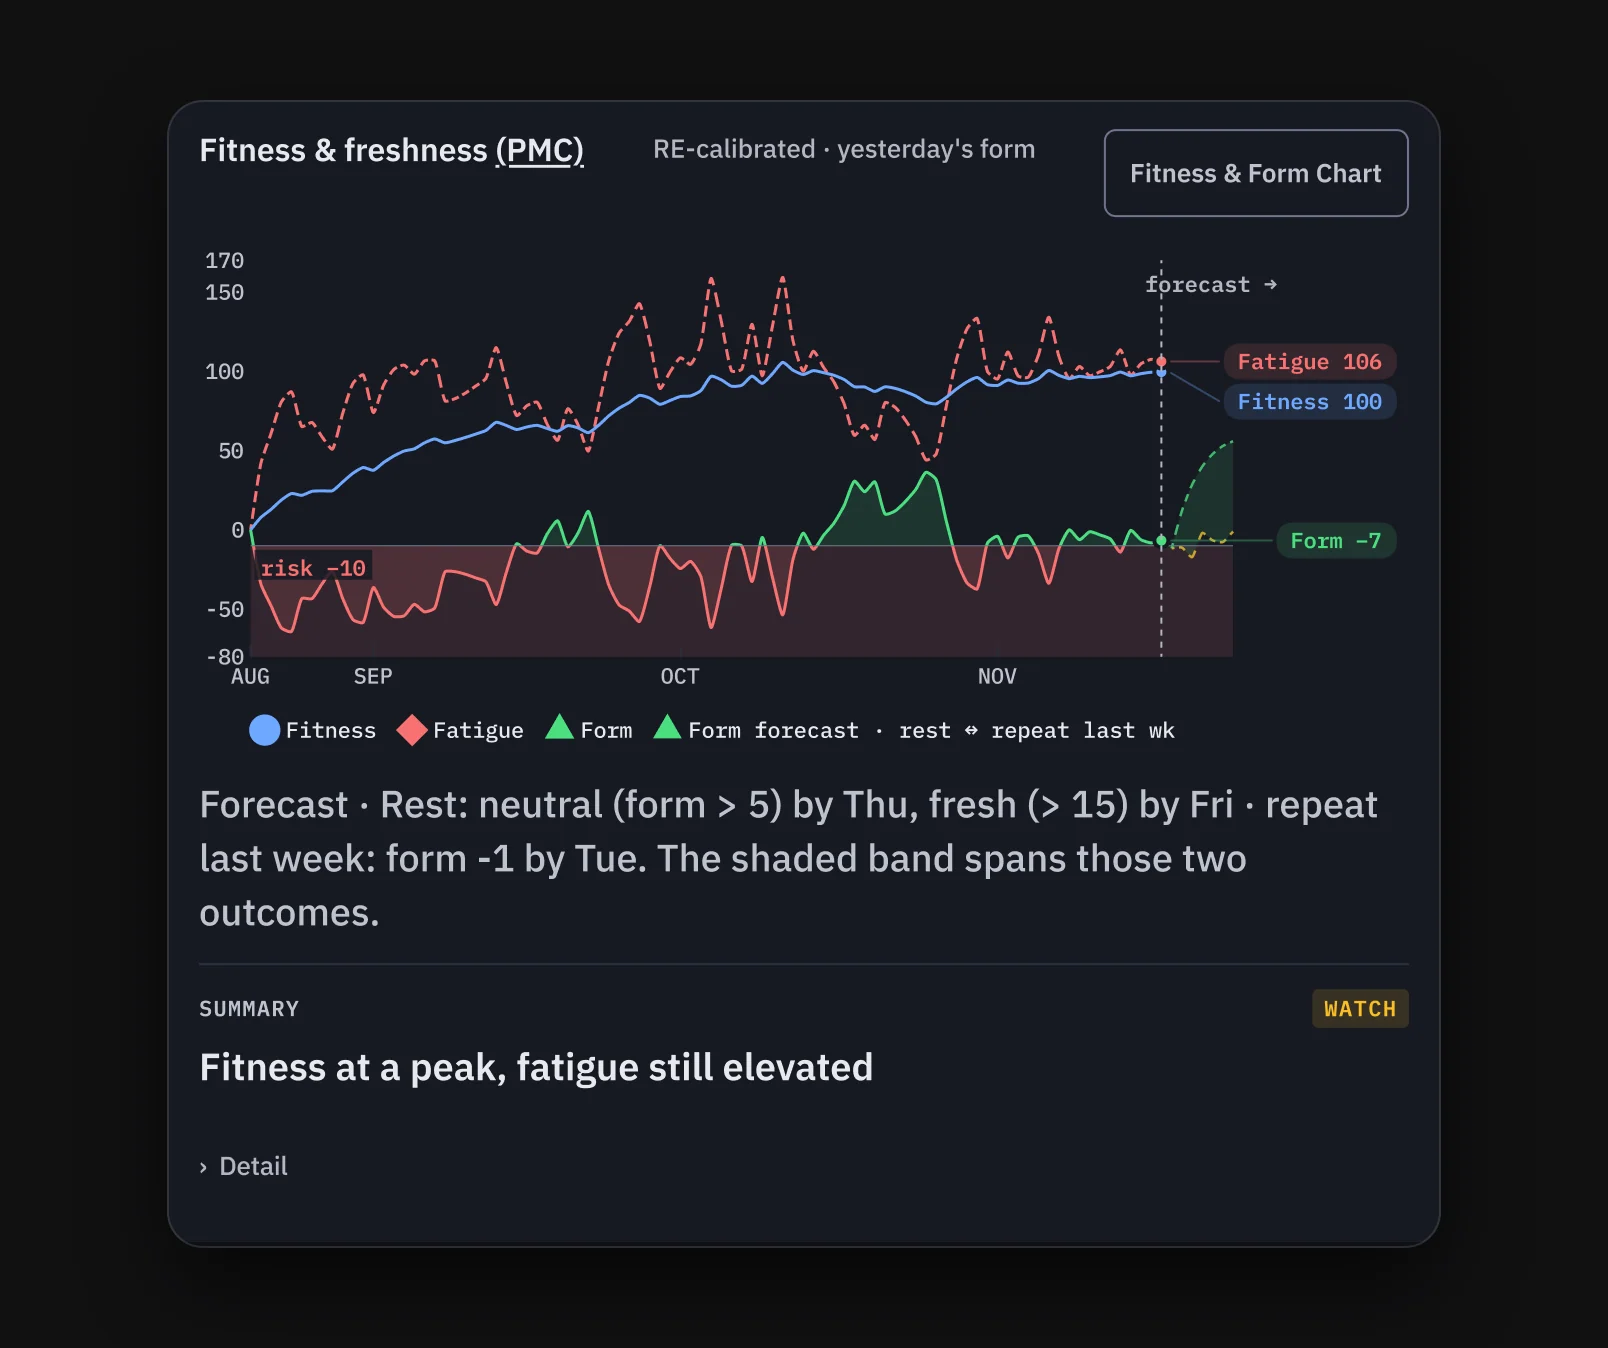
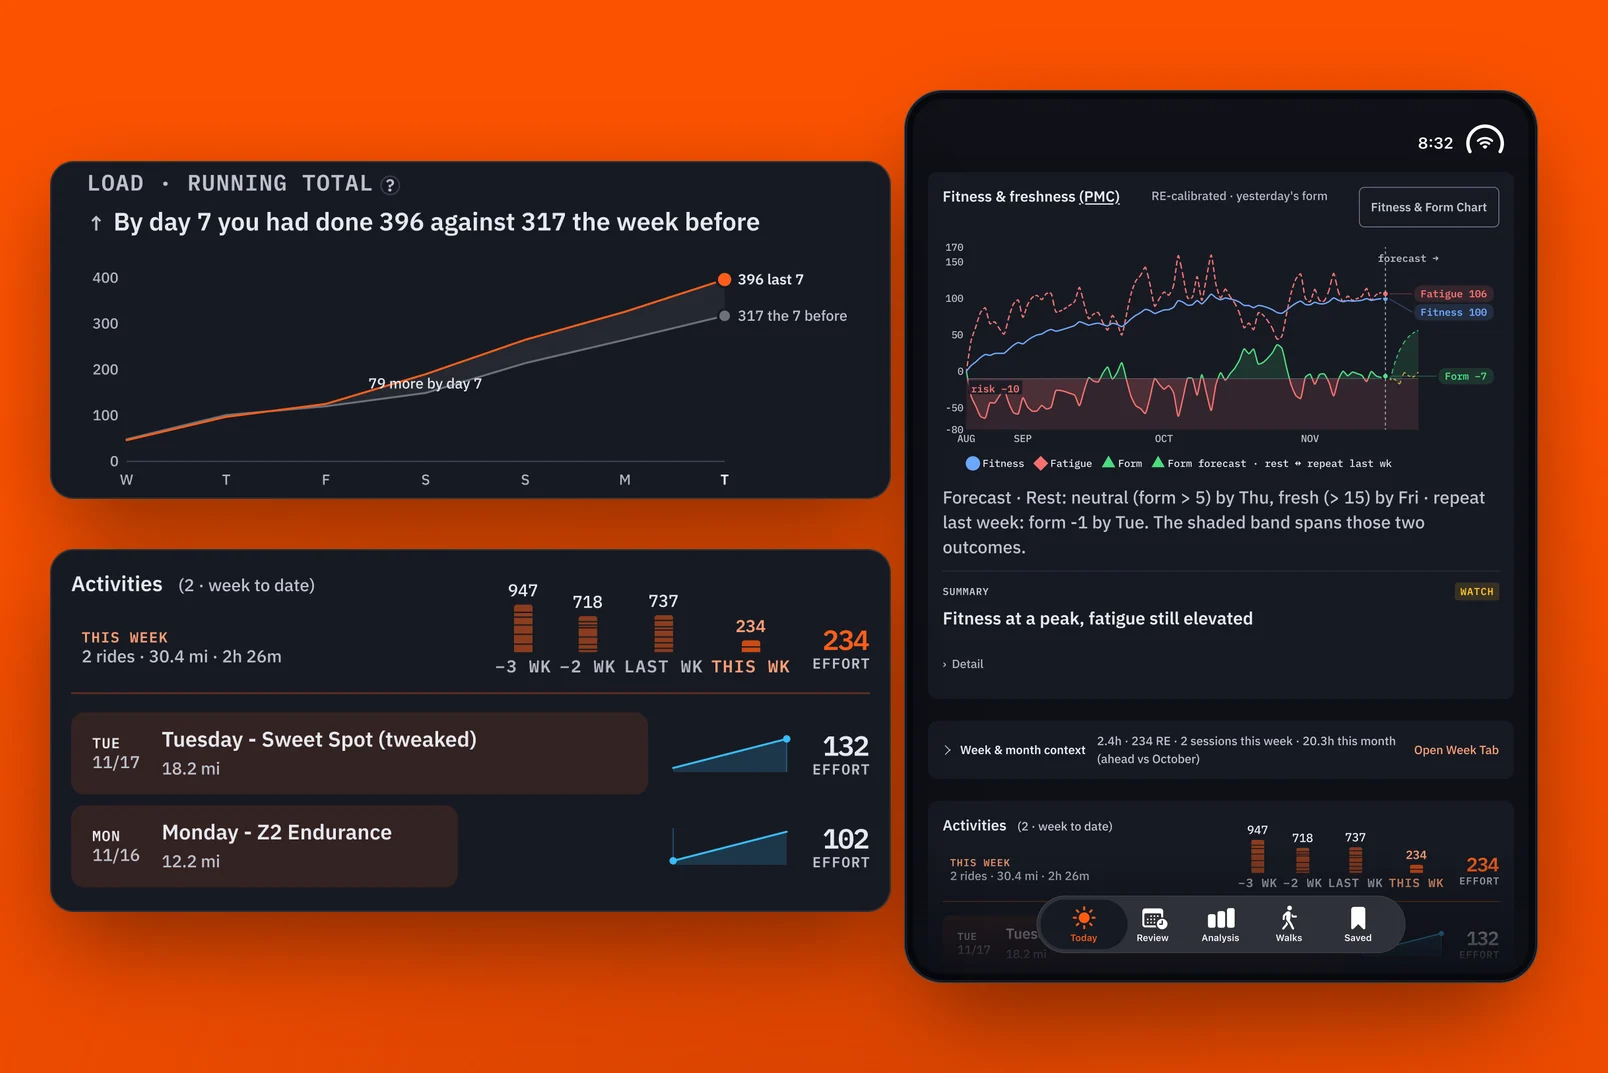
It gave me a chance to explore ways of visualizing data I hadn't tried before, and I experimented a lot with combining two or three data points into one view. The graph that meant the most to me brought fitness, fatigue and form together: the fitness and freshness graph, or PMC. It really helps put my current fitness into perspective. I can see when I'm above the line in green, compared with when I was really burning downward in red.
Fitness and freshness: form in green above the line, red below it.
The app also tracks routes, keeping a record of each map and its elevation. It isn't as helpful as a real-world ride, but it does make it easy to forget I'm on a stationary bike.
My typical week has three hard days, with easier days before and after them. For a while, though, I was really burning my engine without much to show for it: no real increase in my FTP or HRV. I used AI to look at a full year's worth of data to see which patterns my body responded to best. The questions shifted from what the data looked like to what AI could do with it to help me understand, and how it could change my workouts.
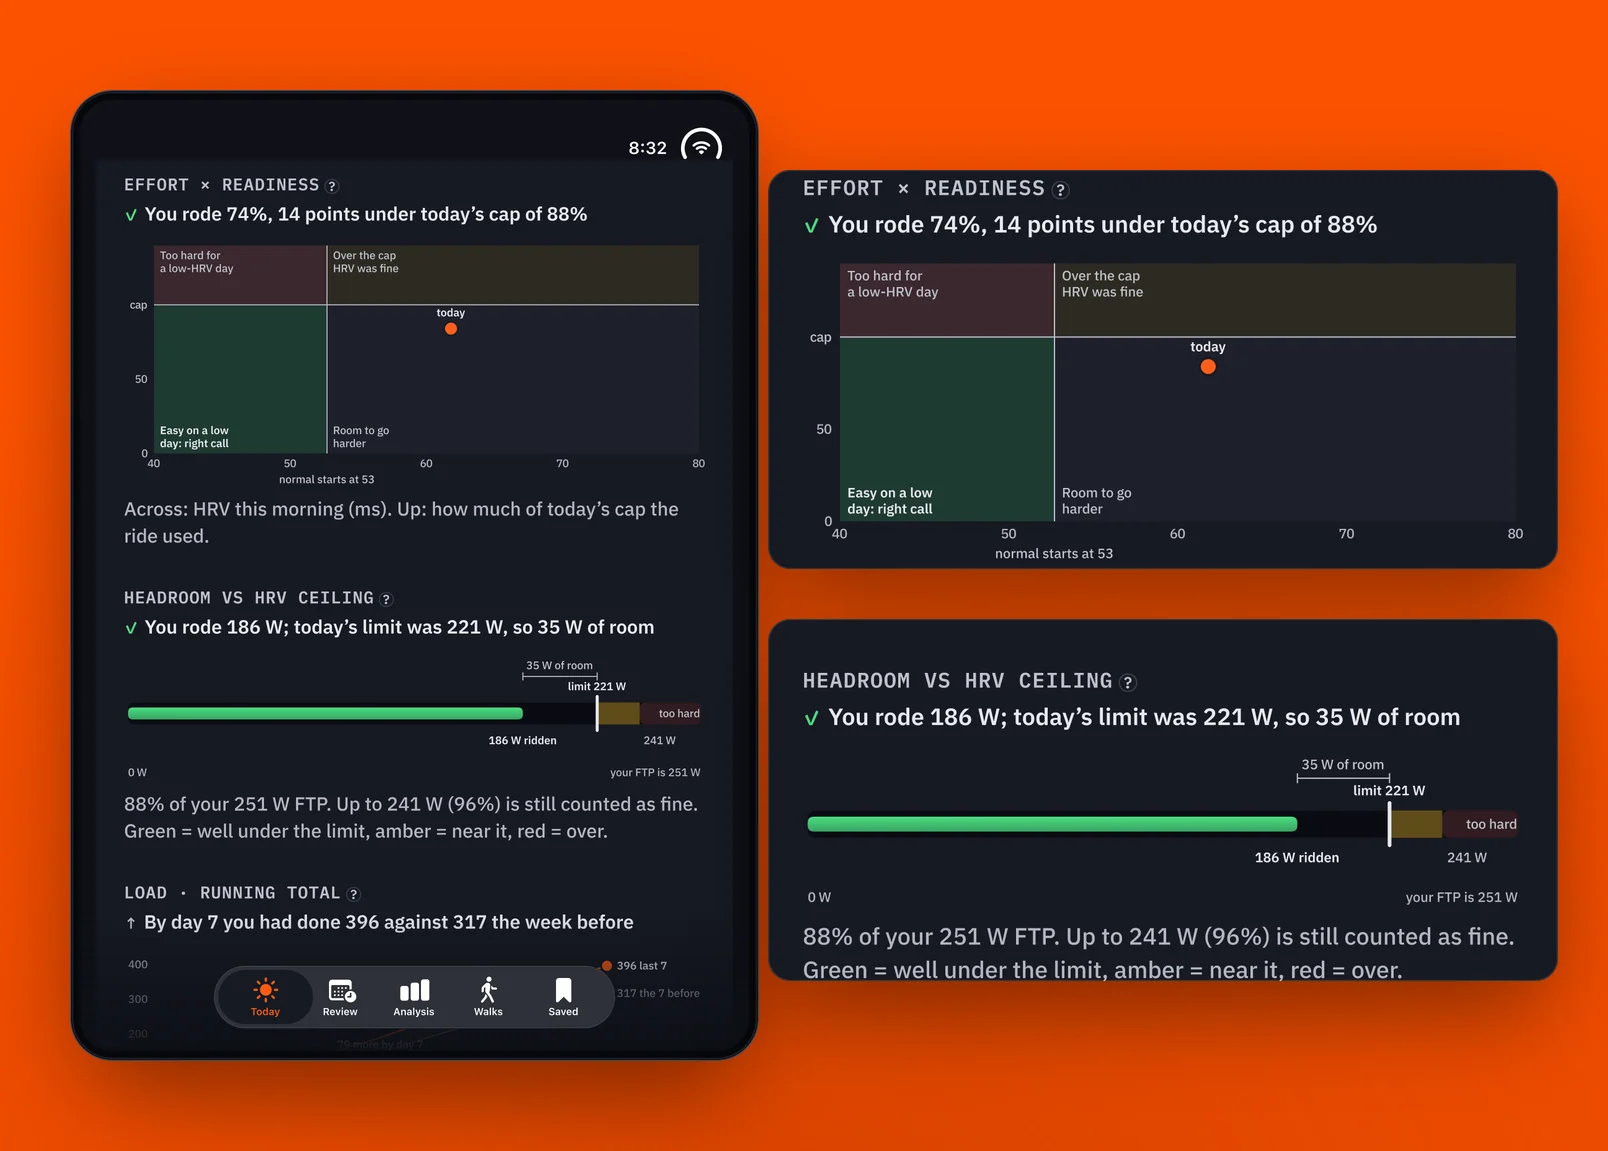
How much of today’s ceiling the ride used.
That led to HRV Ride, the app I now use to create my workouts. It takes data from my previous rides and builds a workout that I upload to Zwift. Alongside it is Signal, my "doctor in my pocket" app. It isn't a real doctor, but it takes my Apple HealthKit and Whoop data and gives me an analysis of how I'm doing when I wake up. It helps me understand my current physical state in a way individual data points might miss.
Once I started designing and using HRV Ride, Strava's purpose changed. In theory, HRV and my fitness score together point to the ride my body most likely needs, not just a comparison of cycling metrics. The data became more of an API driver for my other apps, and I spent less time looking at the comparisons I had built. Strava is now the only one of my apps that uses data from the ride alone. In effect, it's a laggard, and it comes last in the flow.
Three questions
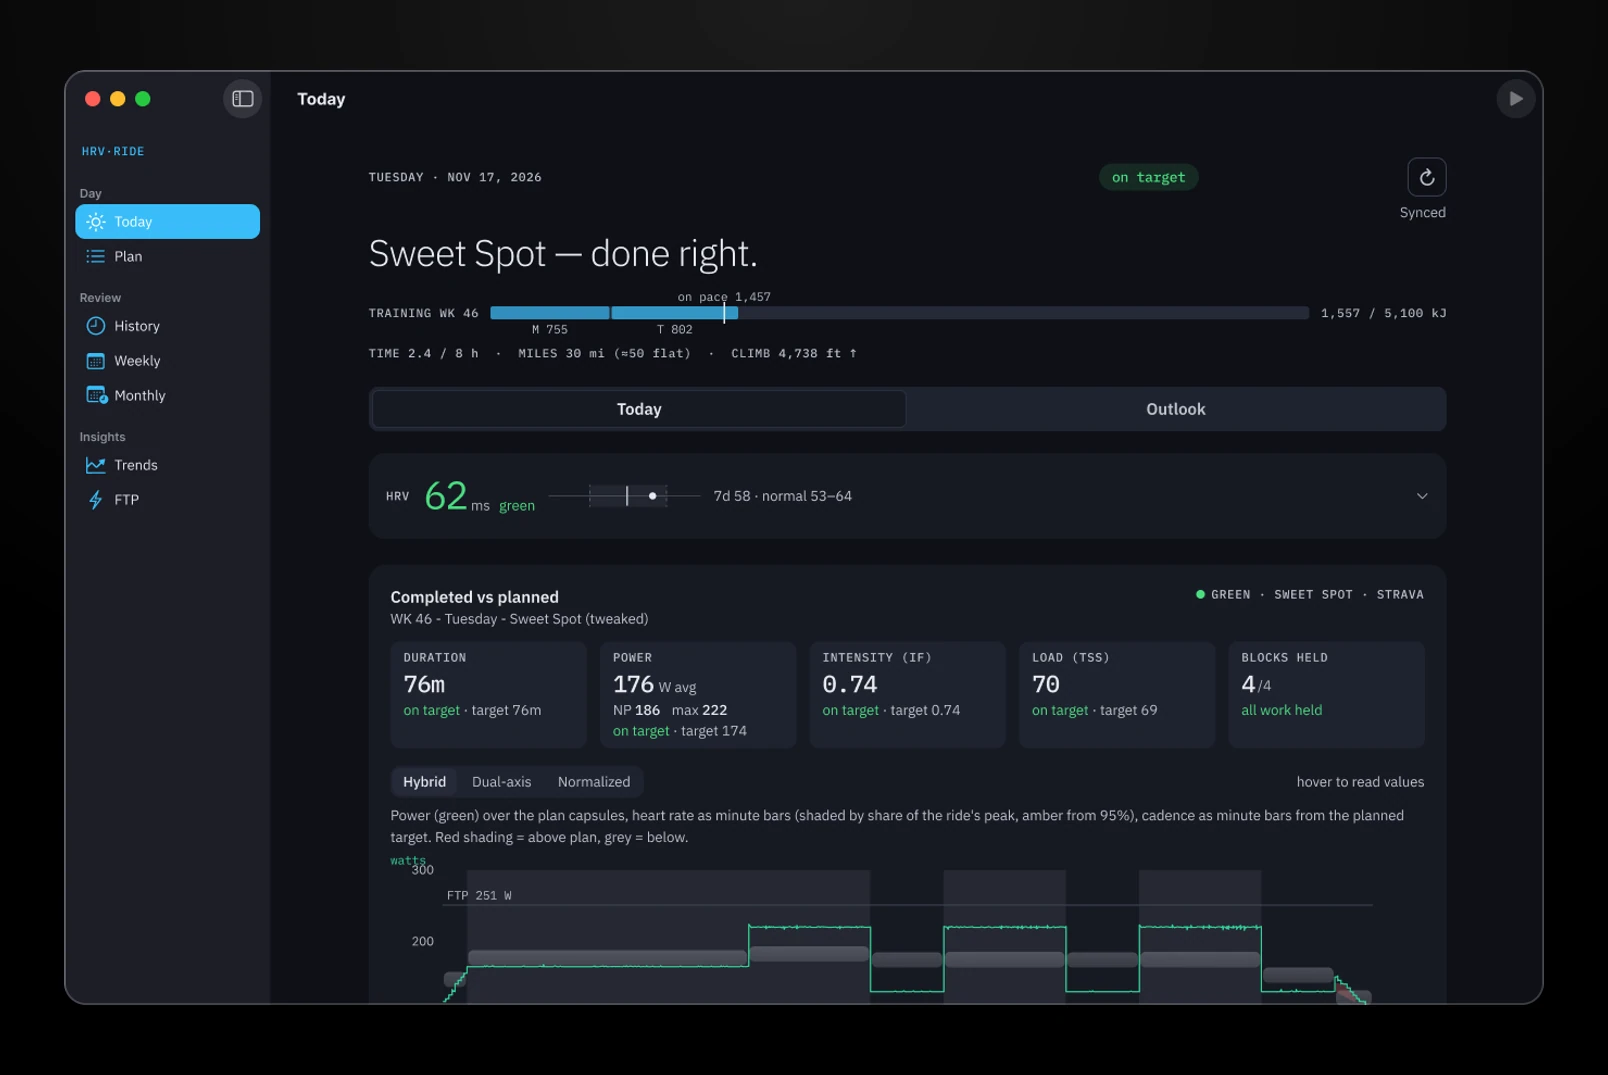
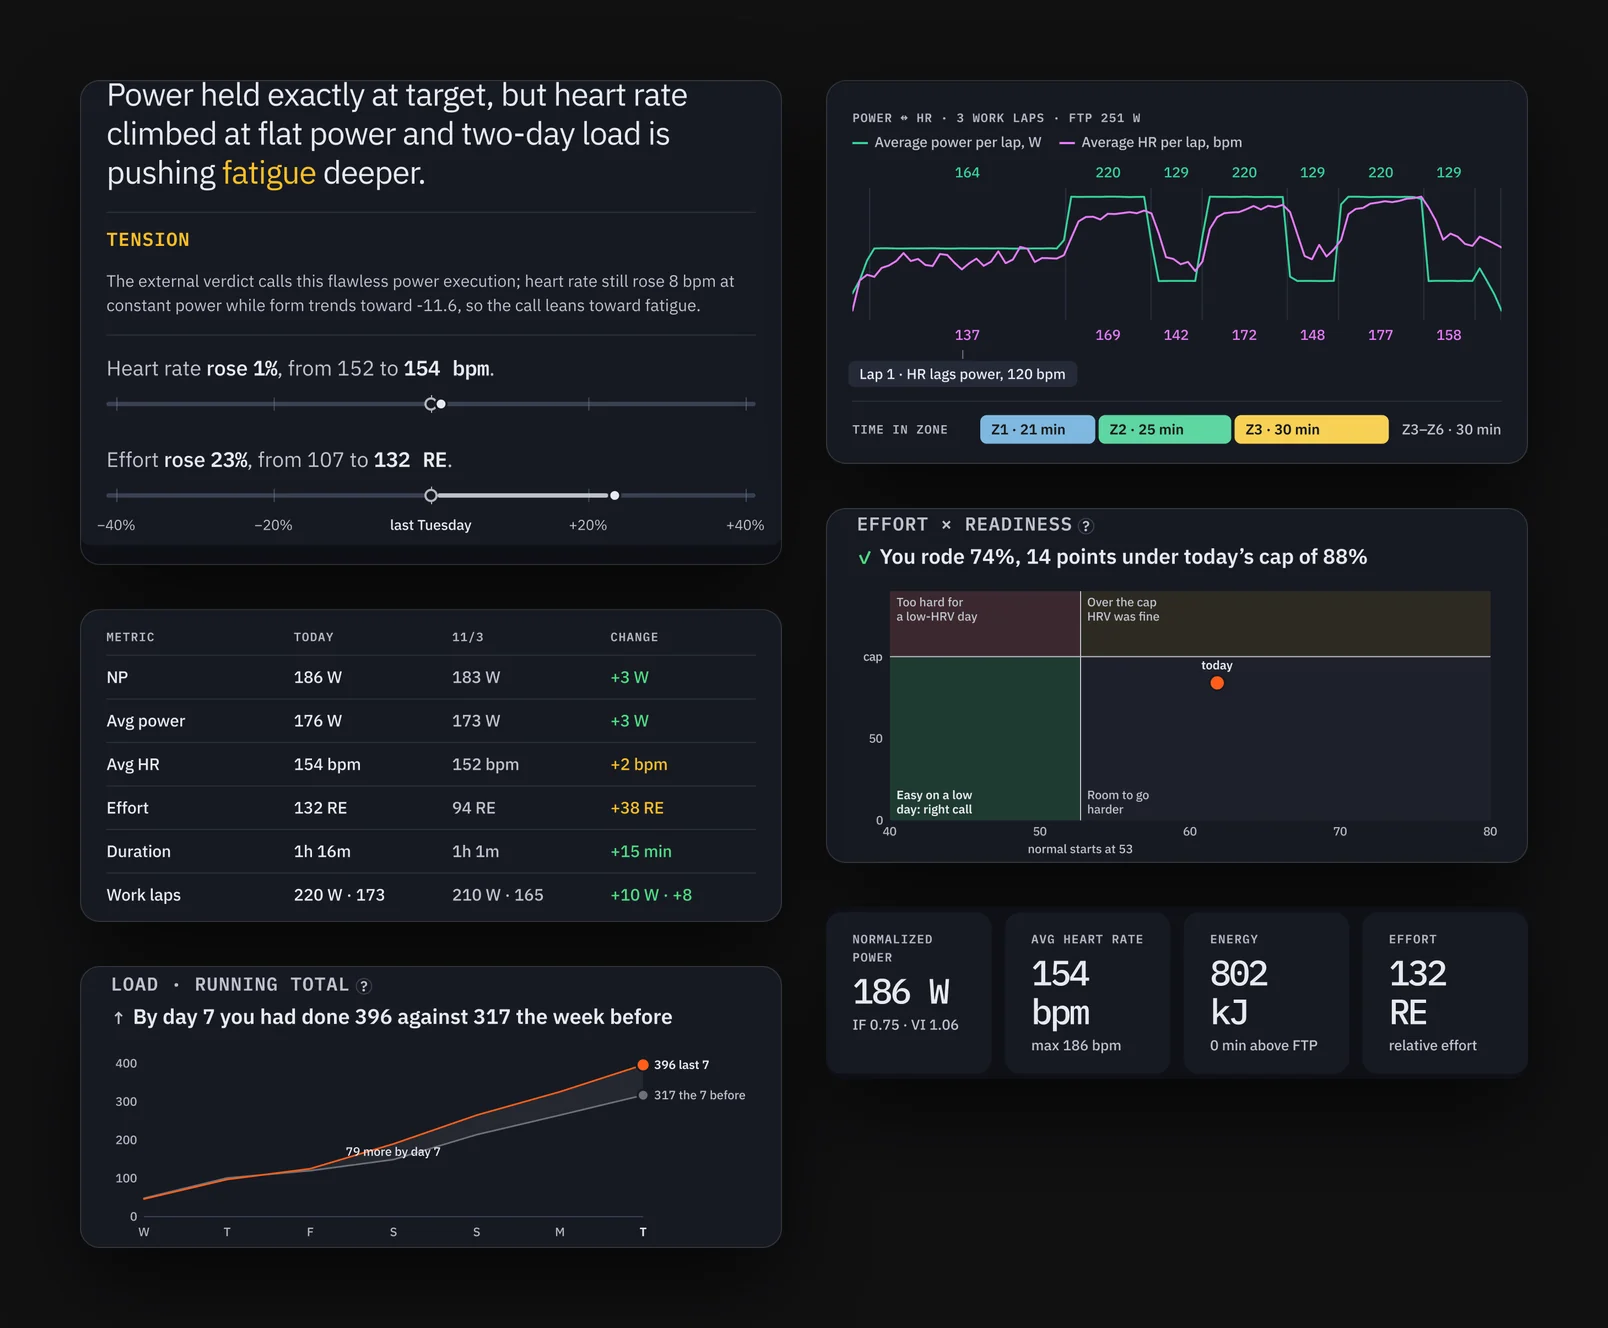
Strava became less about pre-planning and making workouts, and more about reviewing what I had just accomplished, learning from it, and making my week and month easy to read with little to no clicking. Immediately after a ride, the app answers three questions:
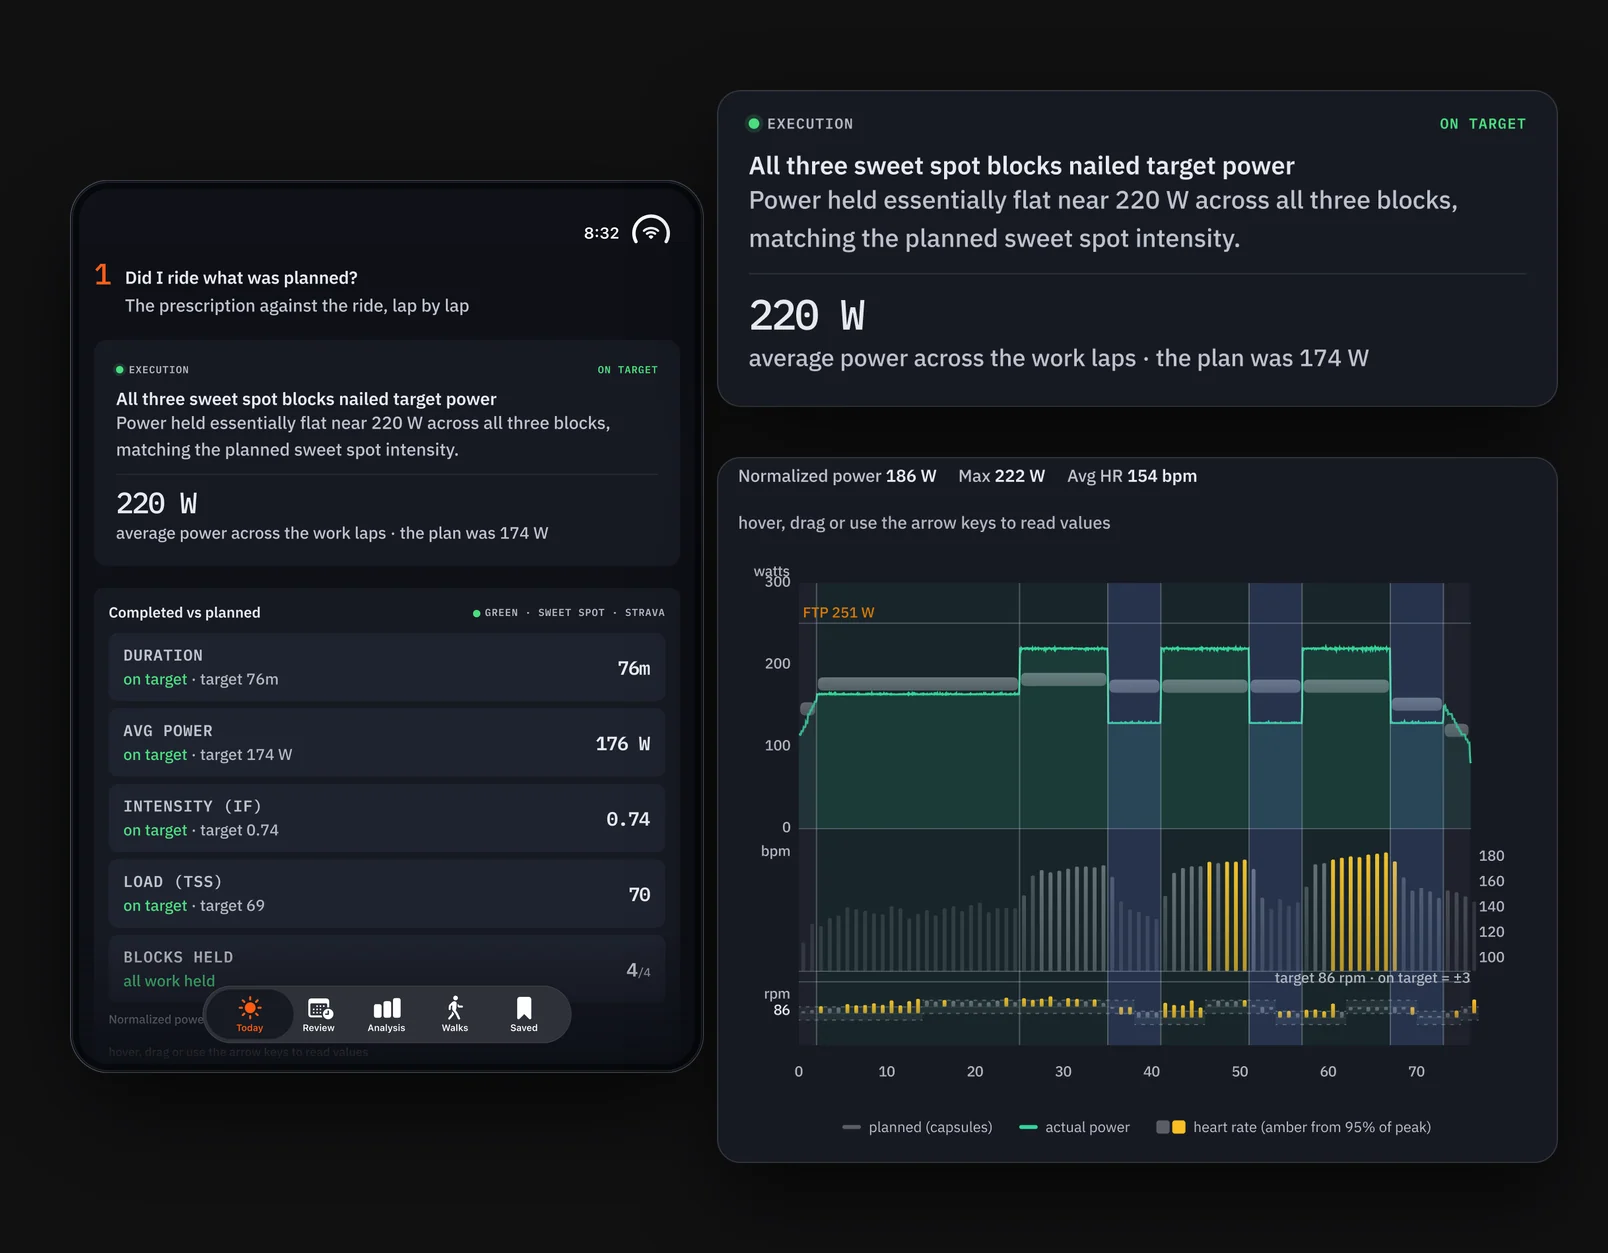
1. Did I ride what was planned? I've just completed a ride that was recommended to me.
Did I ride what was planned?
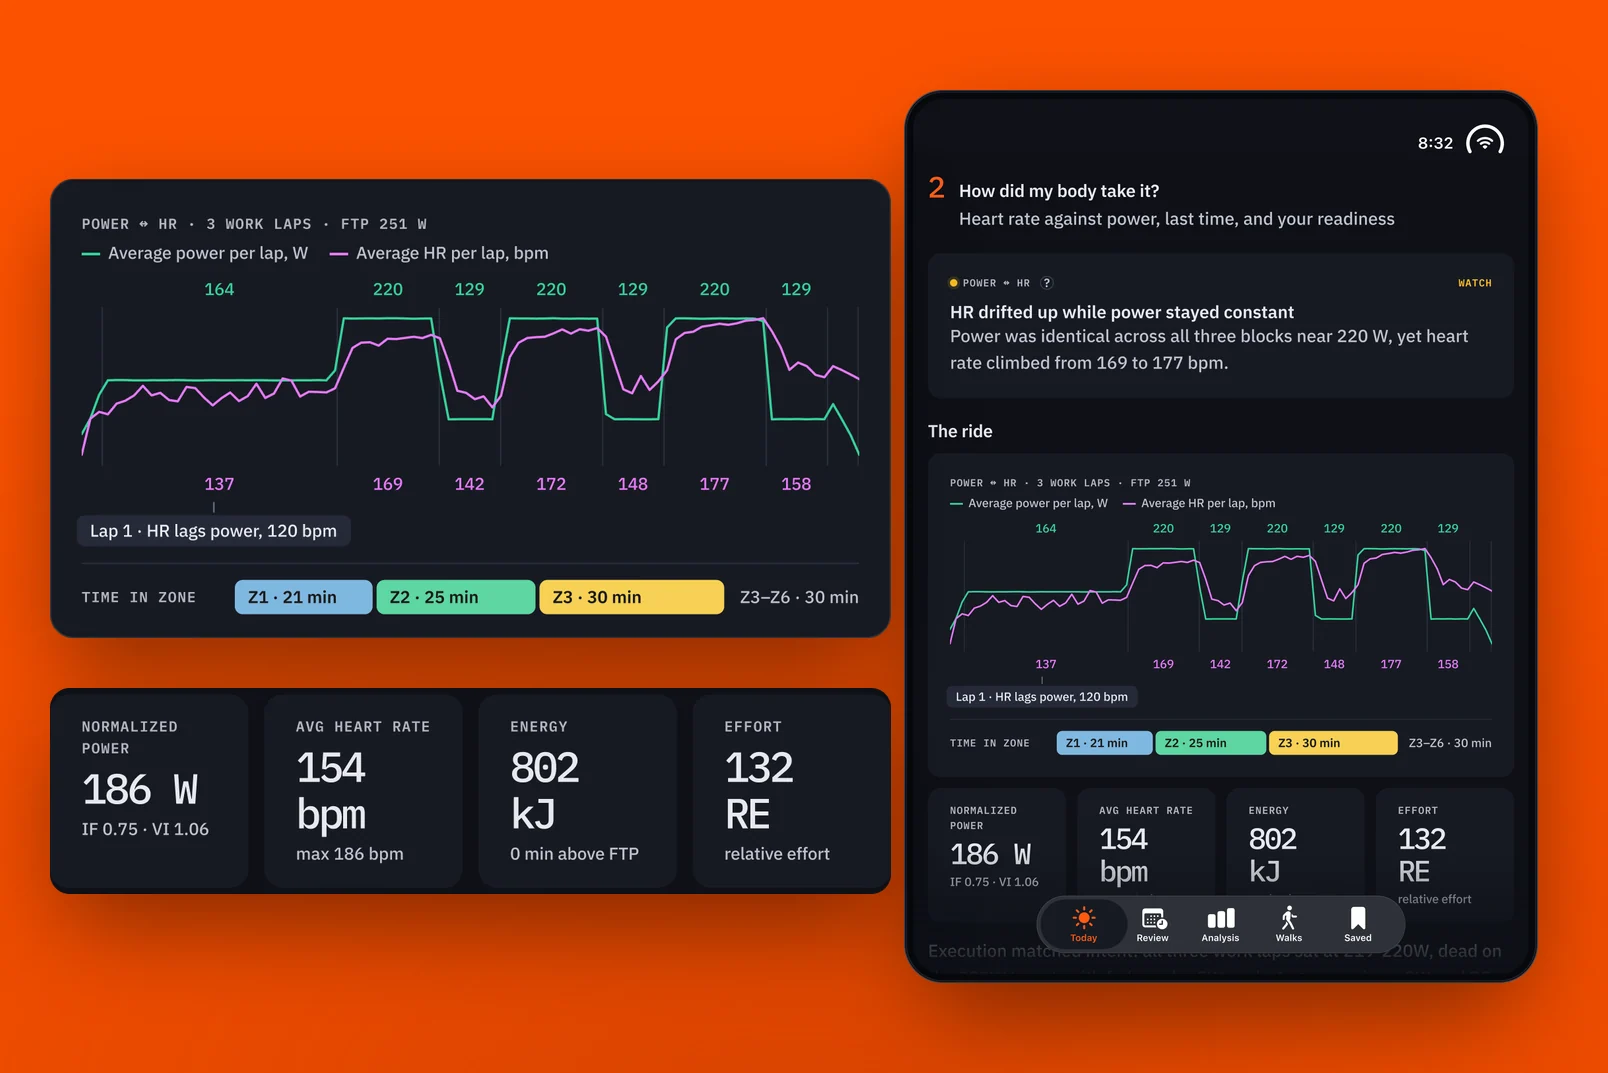
2. How did my body take it? I want to know, from a physiological perspective, whether my body responded the way the ride intended. Was my heart rate in the zones it should have been, or did it go higher? If it went higher than planned, by how much?
How did my body take it?
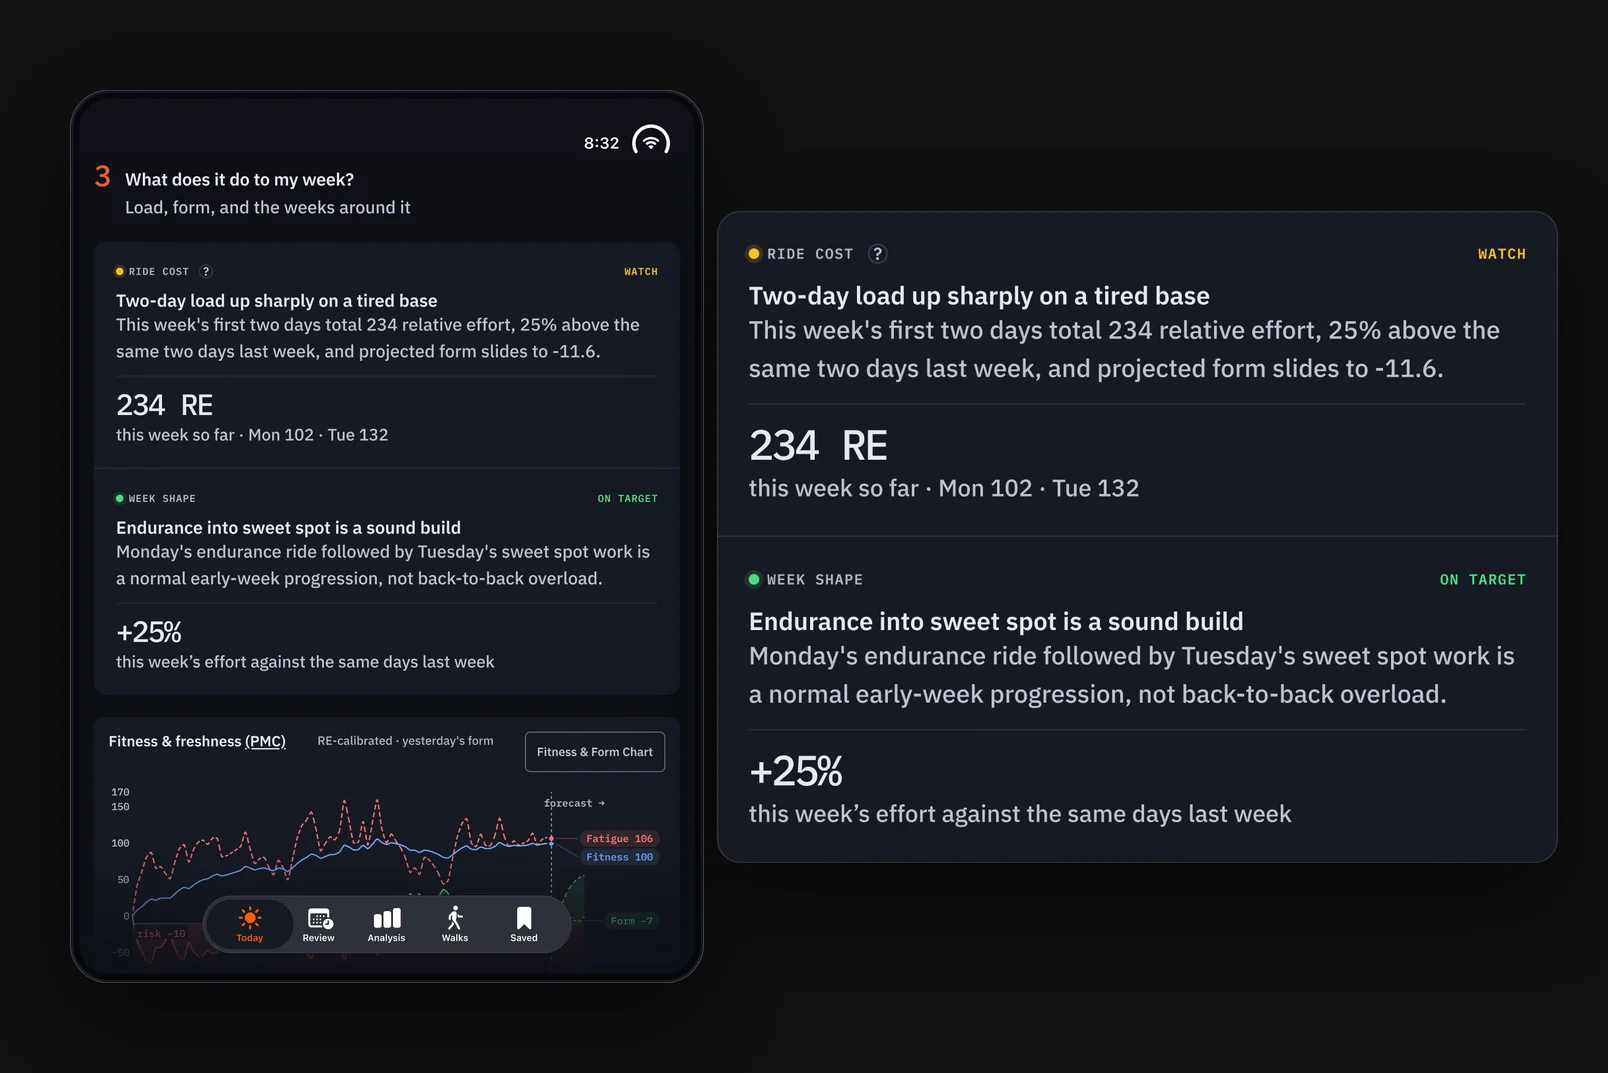
3. What does it do to my week? Now that the ride is done, does it fit my energy budget, or did it go well off in one direction or the other? Will I need to lighten the intensity over the next couple of days, or put in more effort?
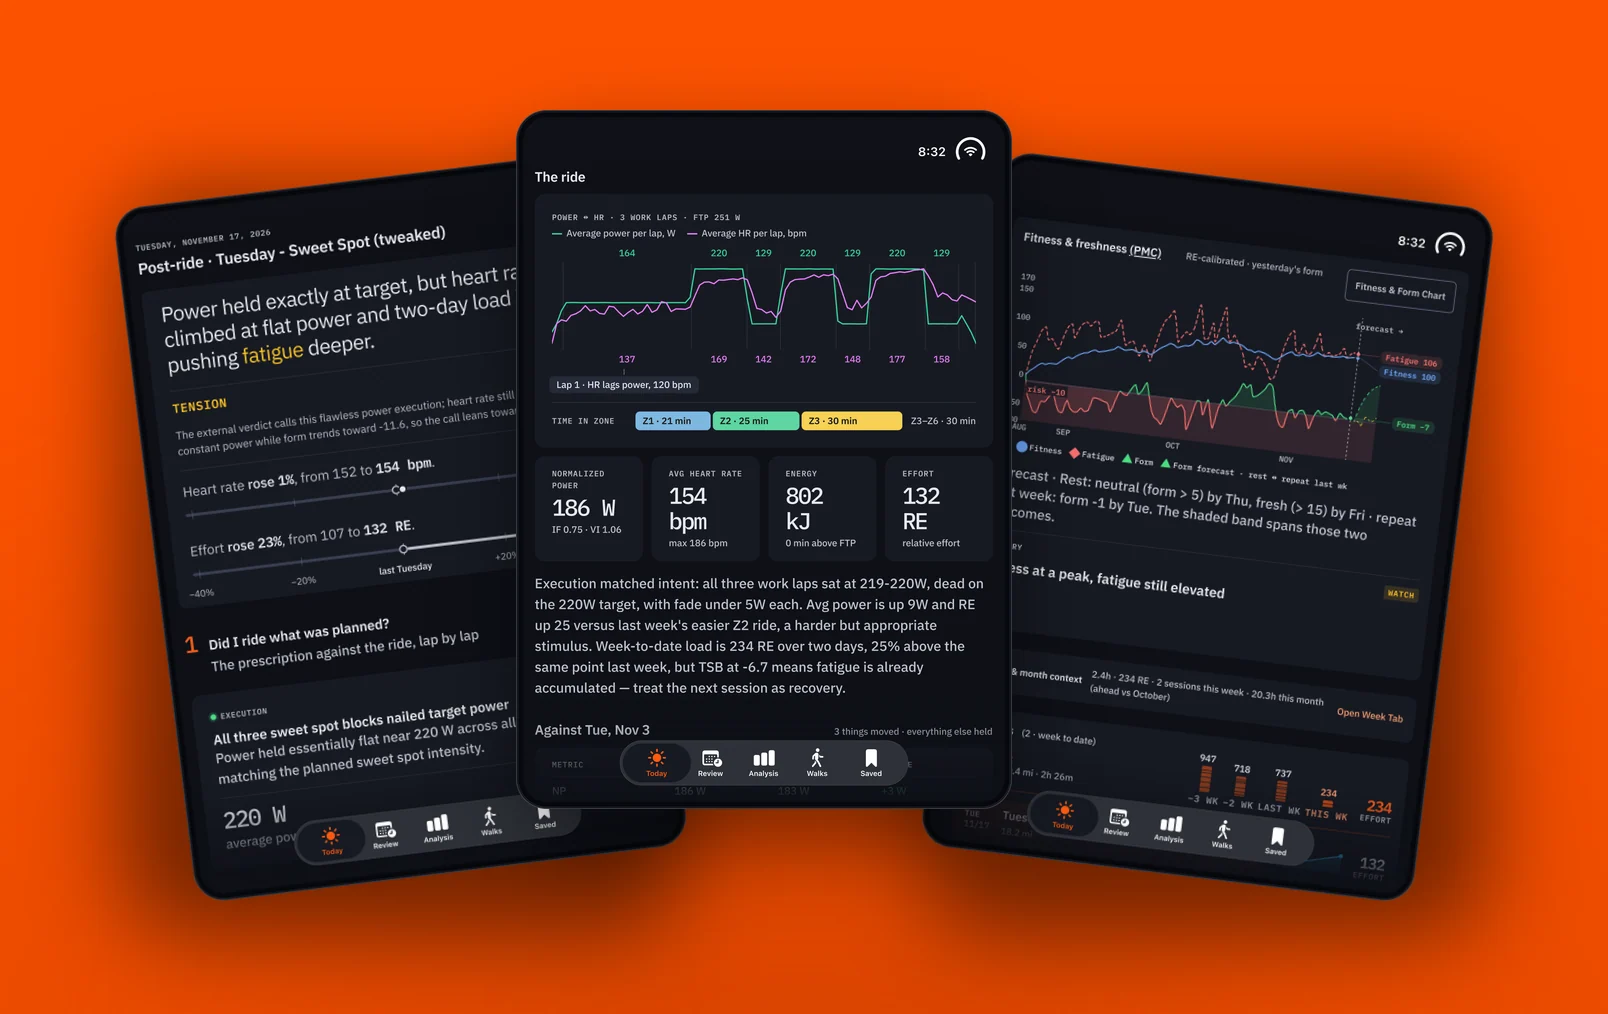
What does it do to my week?Right after a ride: the verdict, the ride, and where it landed.
Usually the answers land where I'd expect them to, if the plan is doing its job. In aggregate, the data helps at the end of the week and month to show me how my riding fitness really went. One off day, or one exceptionally good one, doesn't change the monthly trend much, and the trend is what I'm curious about. With my new workout setup, I'm staying in the green on the PMC a lot more. The workouts adjust more granularly and give my body more time to recover, which in turn is helping my fitness.
The trend is what I’m curious about.
Moving from the web to iOS helped from a practical perspective. I can look at the analysis on my iPhone right after a ride, instead of waiting until I get to my computer after I've showered. In practice, I either look at it right after a ride or not at all that day, and sometimes I only check in at the end of the week or month.
It's not that I don't find the information interesting. But what am I going to spend a finite amount of time looking at? This data directly shapes the next workout, which is great. After a while I know where the data comes from and how it influences the workout, so I'm less likely to study each data card. On the other hand, if I didn't have the visualizations, I wouldn't take the data as seriously as I do, as something real.
The visualizations are what make the data feel real.
What's next
I don't spend much time in the pre-ride view. It has coach's notes left over from the early days, before HRV Ride. Seeing the week and month in context is useful, but I could bring those over to HRV Ride. For now, I like that Strava keeps this data set separate from my other health metrics.