Signal
Most health apps display data. A doctor pays attention. Those are different products.




Signal · Most health apps display data
Why I built Signal
I heard Greg Brockman on a podcast describe AI at its best as a team of doctors in your pocket: there for you, thinking continuously about how to help. The phrase stuck. I read it less as inspiration and more as a design problem.
I'd been tracking myself for years with Whoop, Strava and Apple Health, all collecting data I rarely looked back on. I was curious to use that data to learn what it would actually mean to have a personal doctor in my pocket. I built Signal in conversation with Claude Code.
The morning check-in
Every morning when I wake up, I open Signal to see how my body recovered from the day before, and how it responded that night while I slept.
I collect a lot of health metrics through my Apple Watch and Whoop. The challenge has always been understanding what they mean and how they fit into bigger trends. I had plenty of metrics, but I wasn't sure what the data was telling me. So I designed Signal for myself. I wanted control over how this data is presented to me, and over how it's turned into information, whether that's subtle health information or something more. That information, in turn, helps me learn more about AI using data points I'm already familiar with. I also wanted to learn how an agent like that could be created, and how I could tweak it over time.
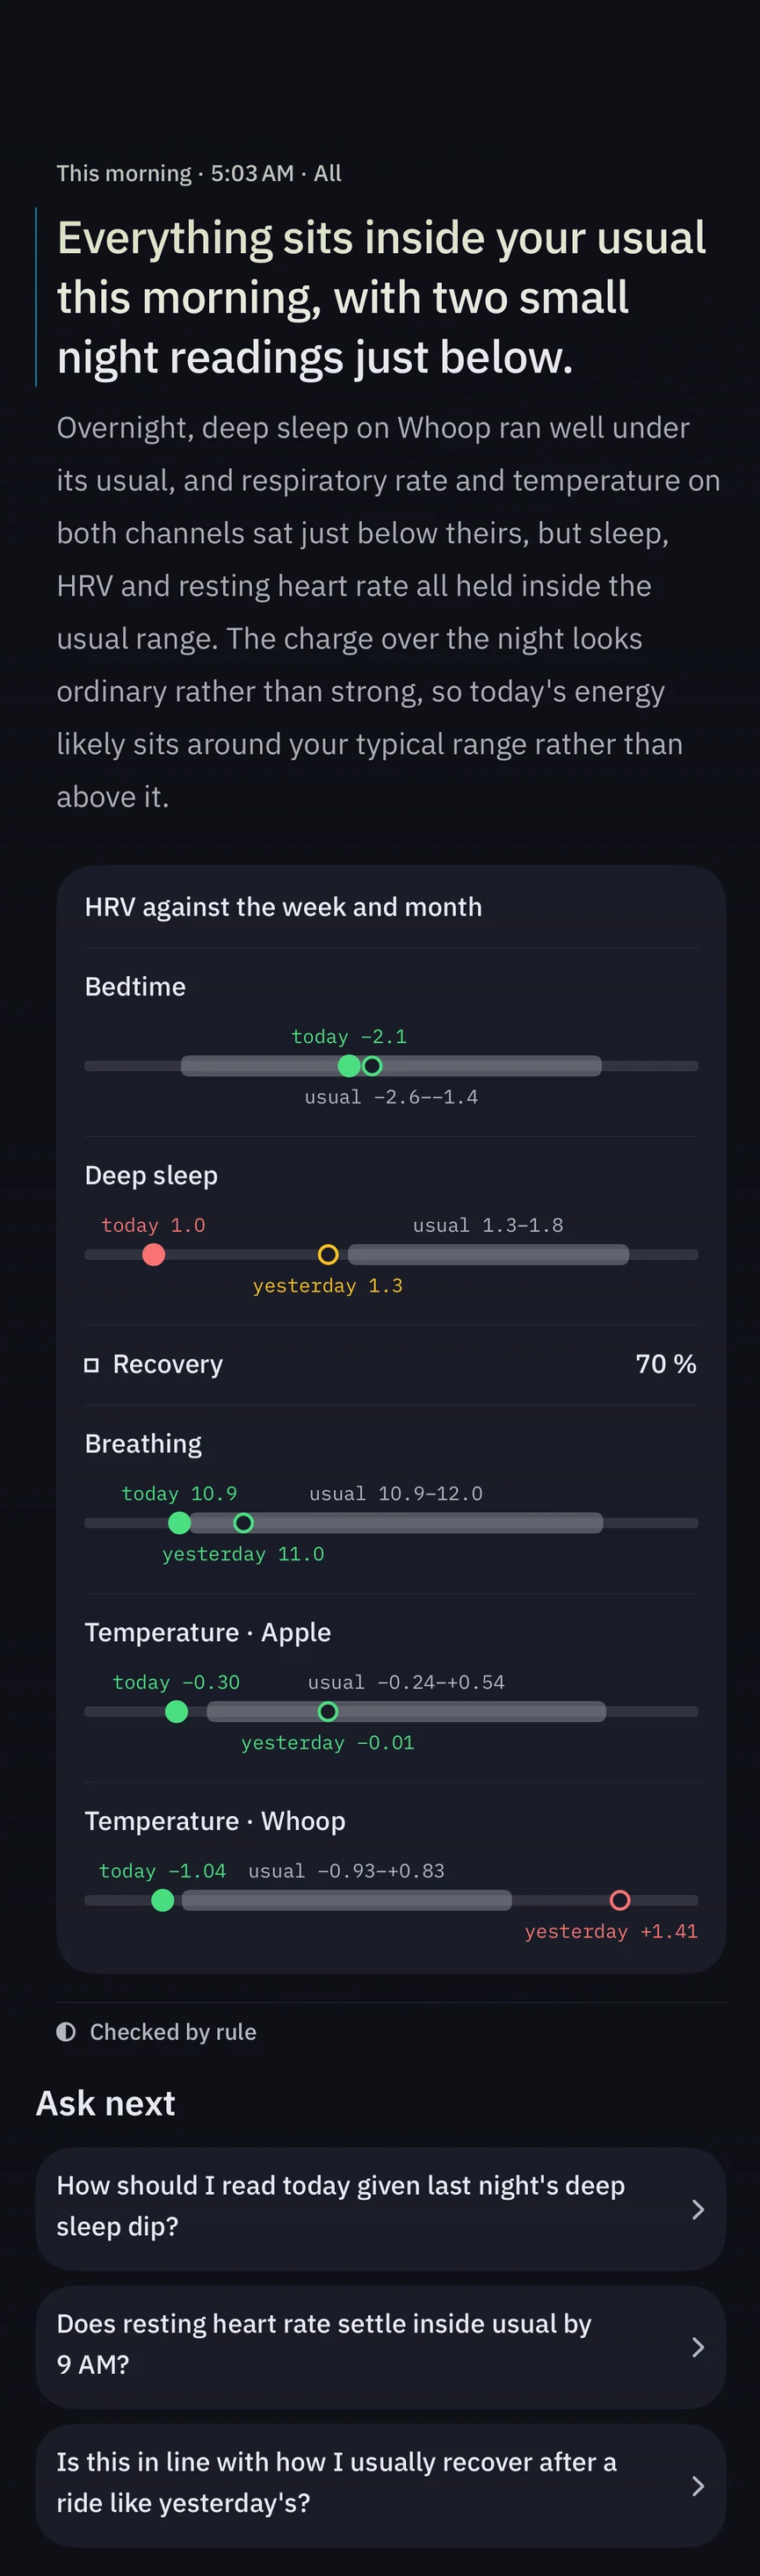
When I open the app, an agent has already collected my Apple HealthKit and Whoop data and analyzed it to explain what happened. It surfaces two or three data points, tells me what's normal and what isn't, and gives me a sense of how my day is likely to go.
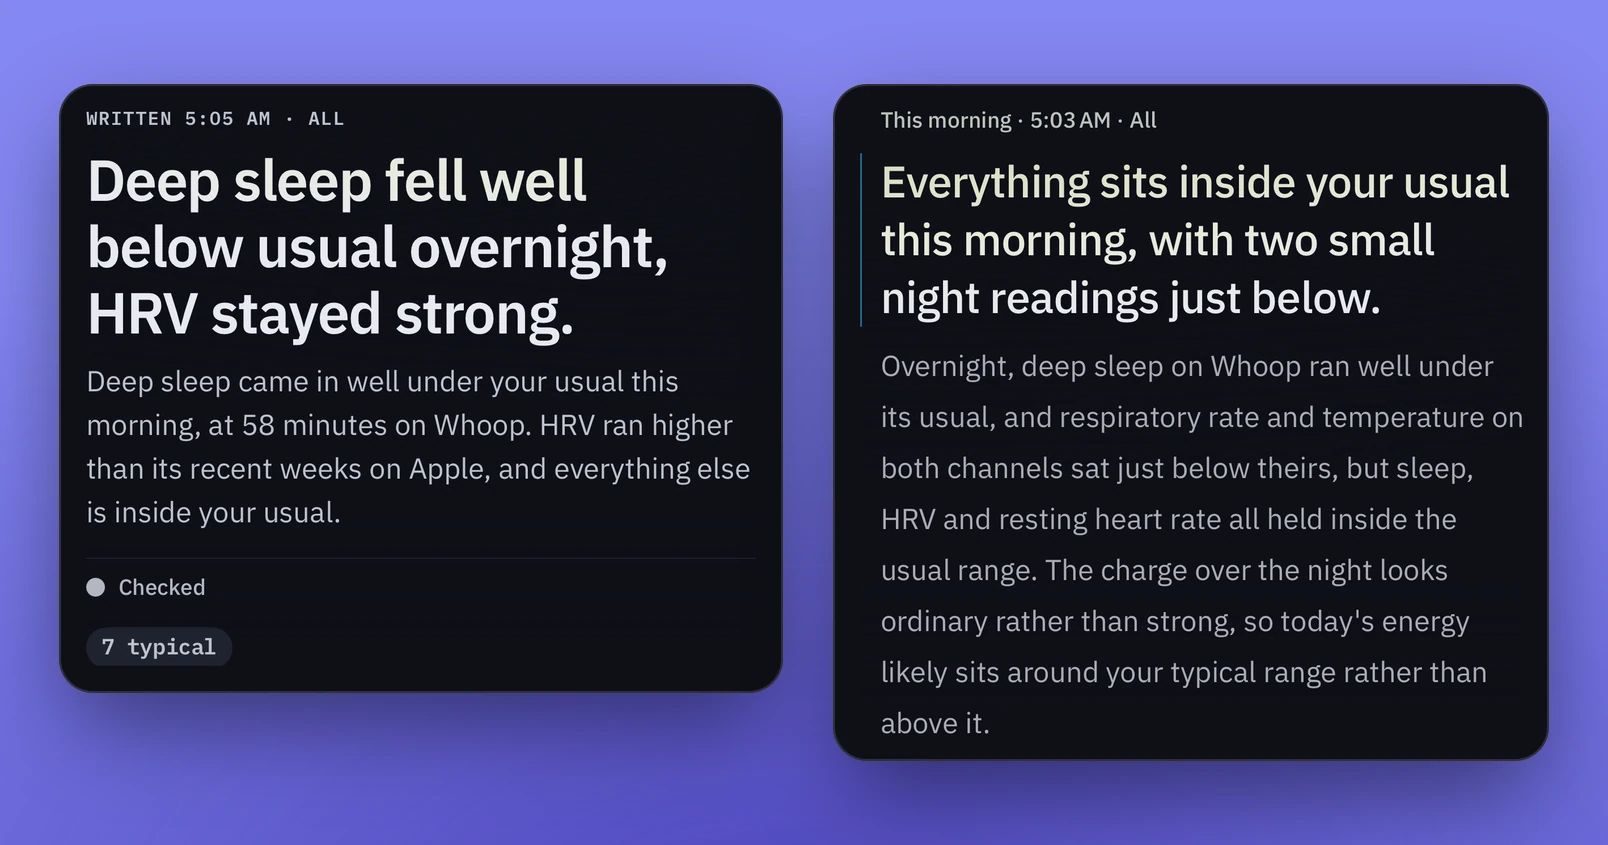
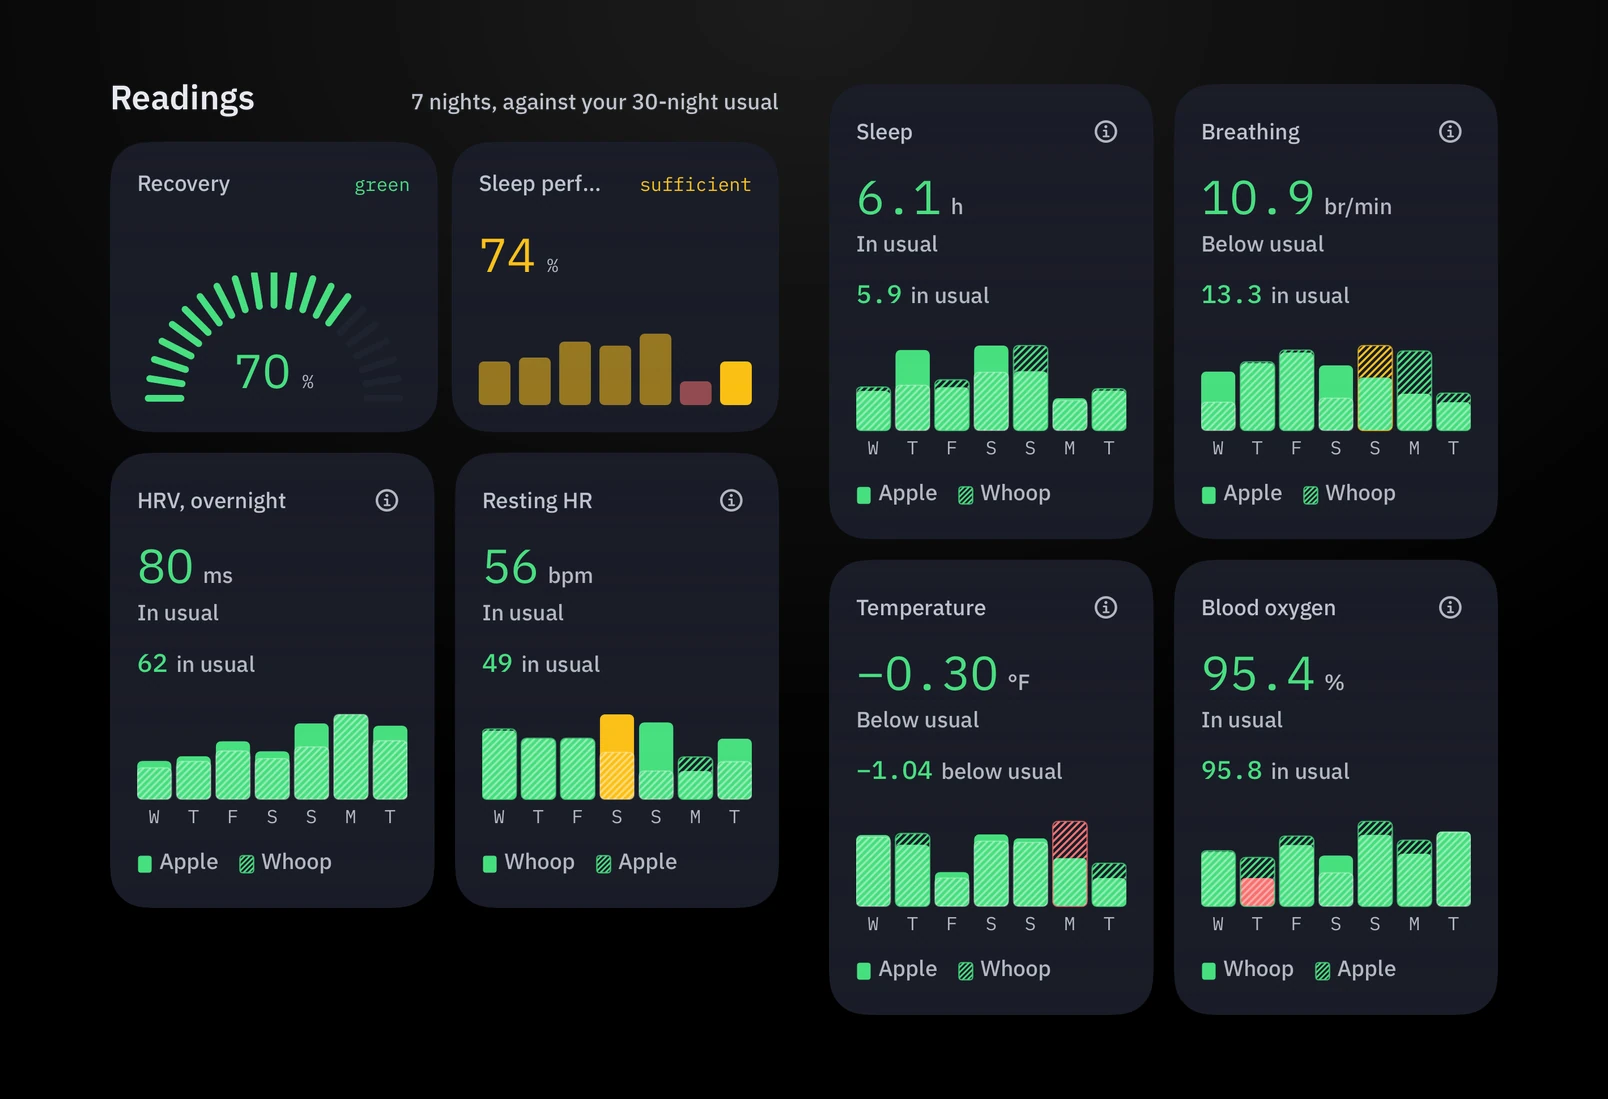
The audio reads it to me while I'm organizing myself in the kitchen. Alongside that, a dashboard covers a broader range of KPIs I can learn a lot from at a glance. It's a helpful way to get context for the day.
The morning is only one part of it. The day is divided into different periods, and each one has a different focus.
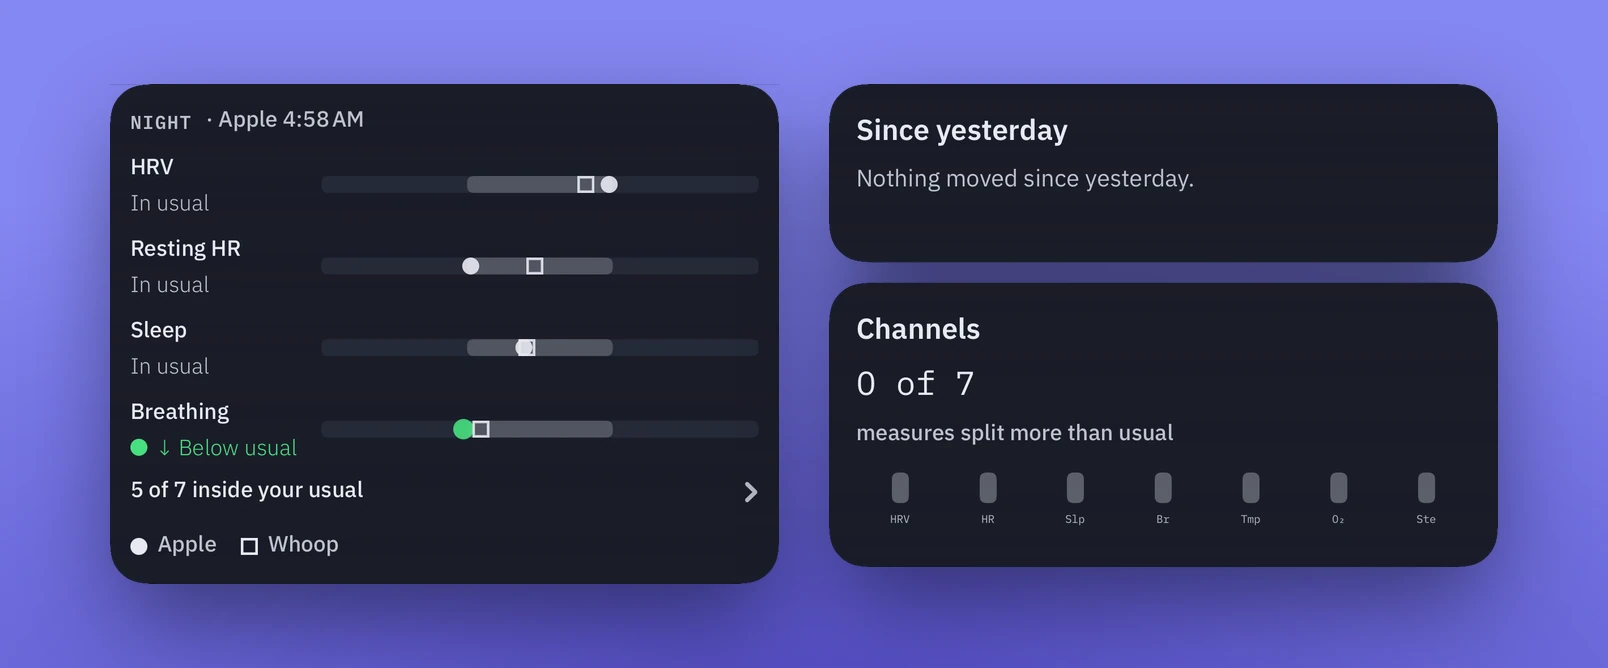
Making sense of it all
From everything to what matters.
It didn't start this way. At first I had every imaginable data point visualized, but it didn't really help me. The question became: how could I turn that data into something that gets me up to speed really quickly? The next version was a simple readout with the data visualized, and the chat was there if I wanted to dig deeper.
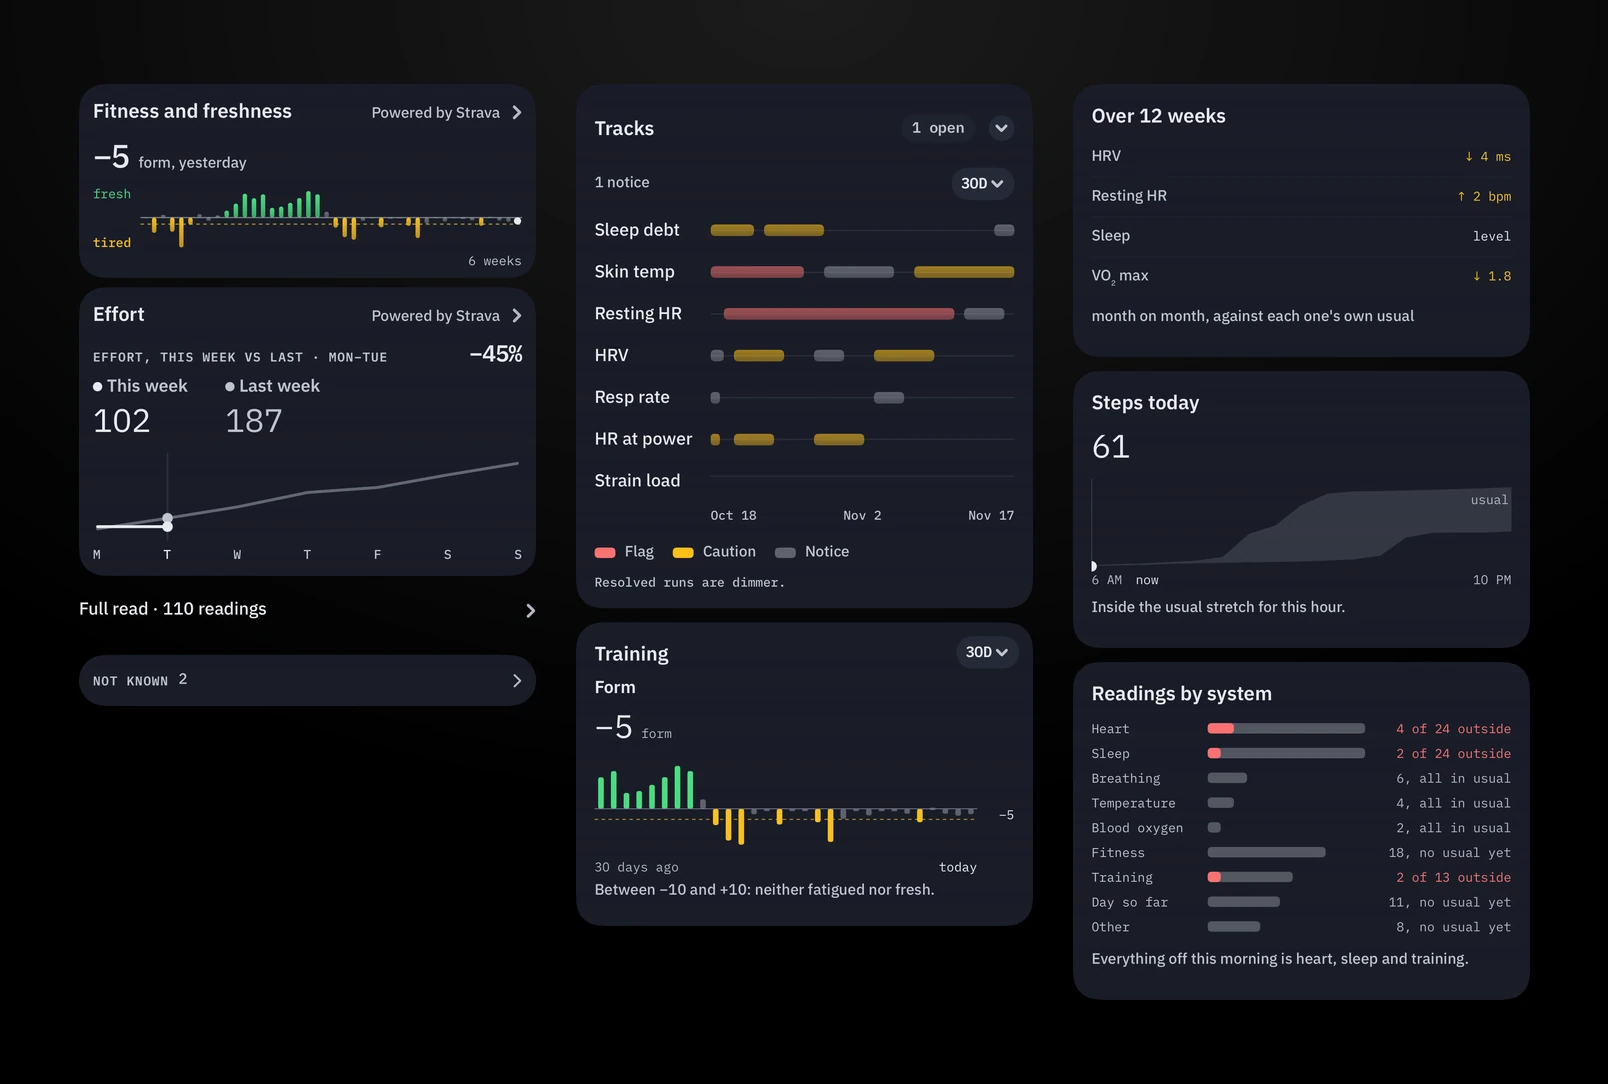
When two sources disagree.
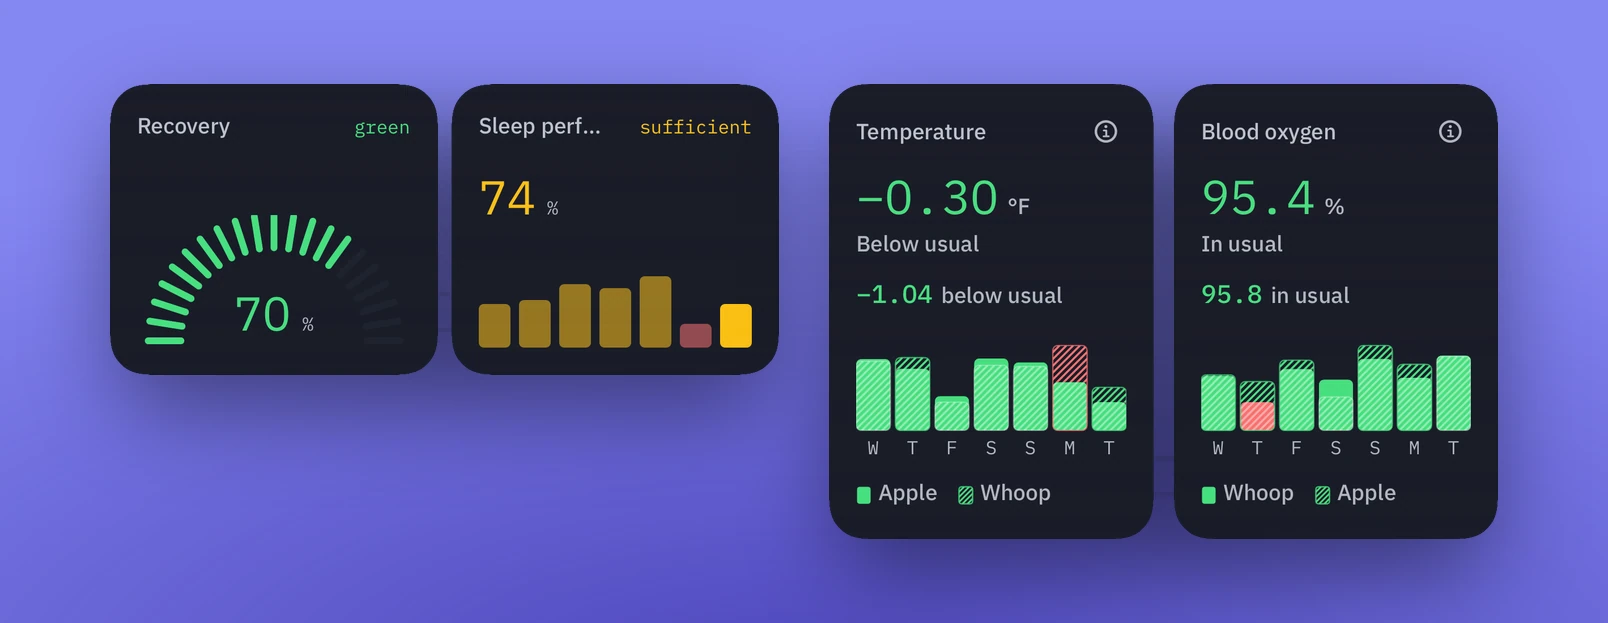
Signal draws on Apple HealthKit and Whoop. Where both capture the same type of measurement, I compare them side by side. One data point becomes the focus, with an explanation of why. Where the two sources differ significantly, Signal shows that too.
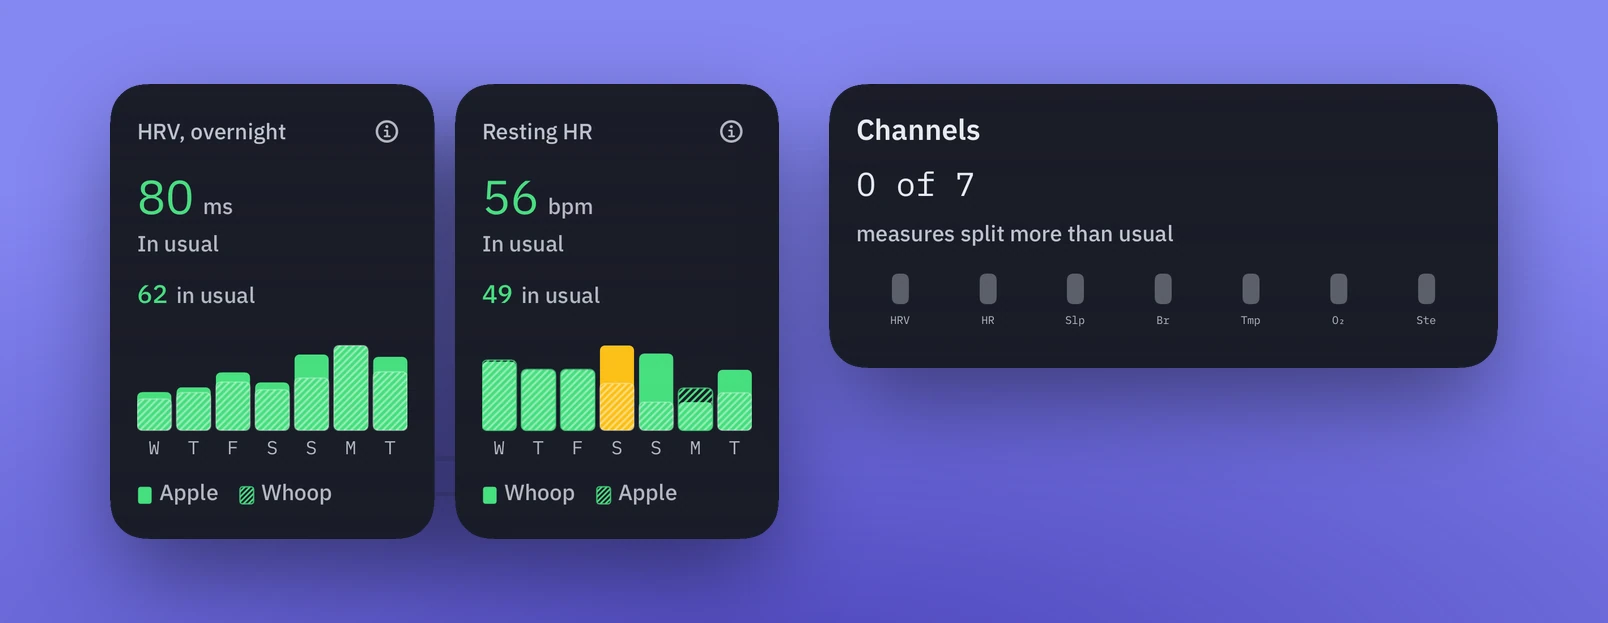
Going deeper without getting lost.
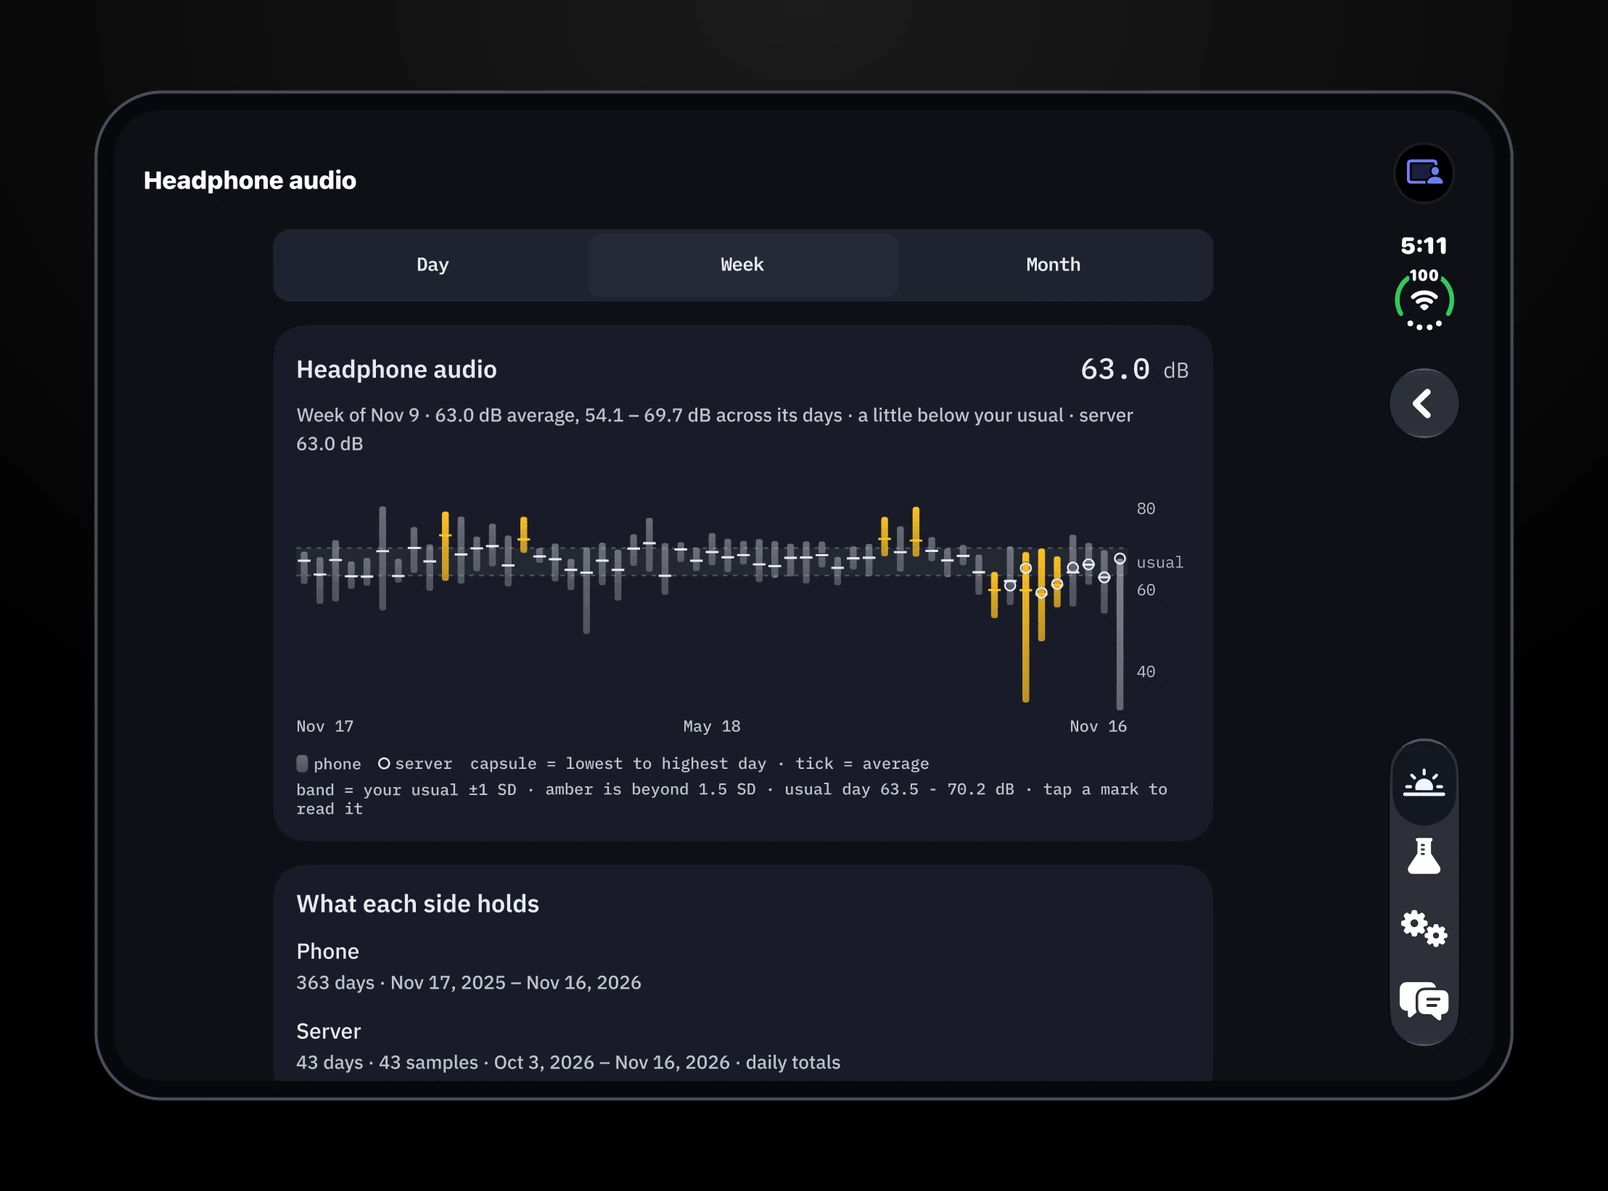
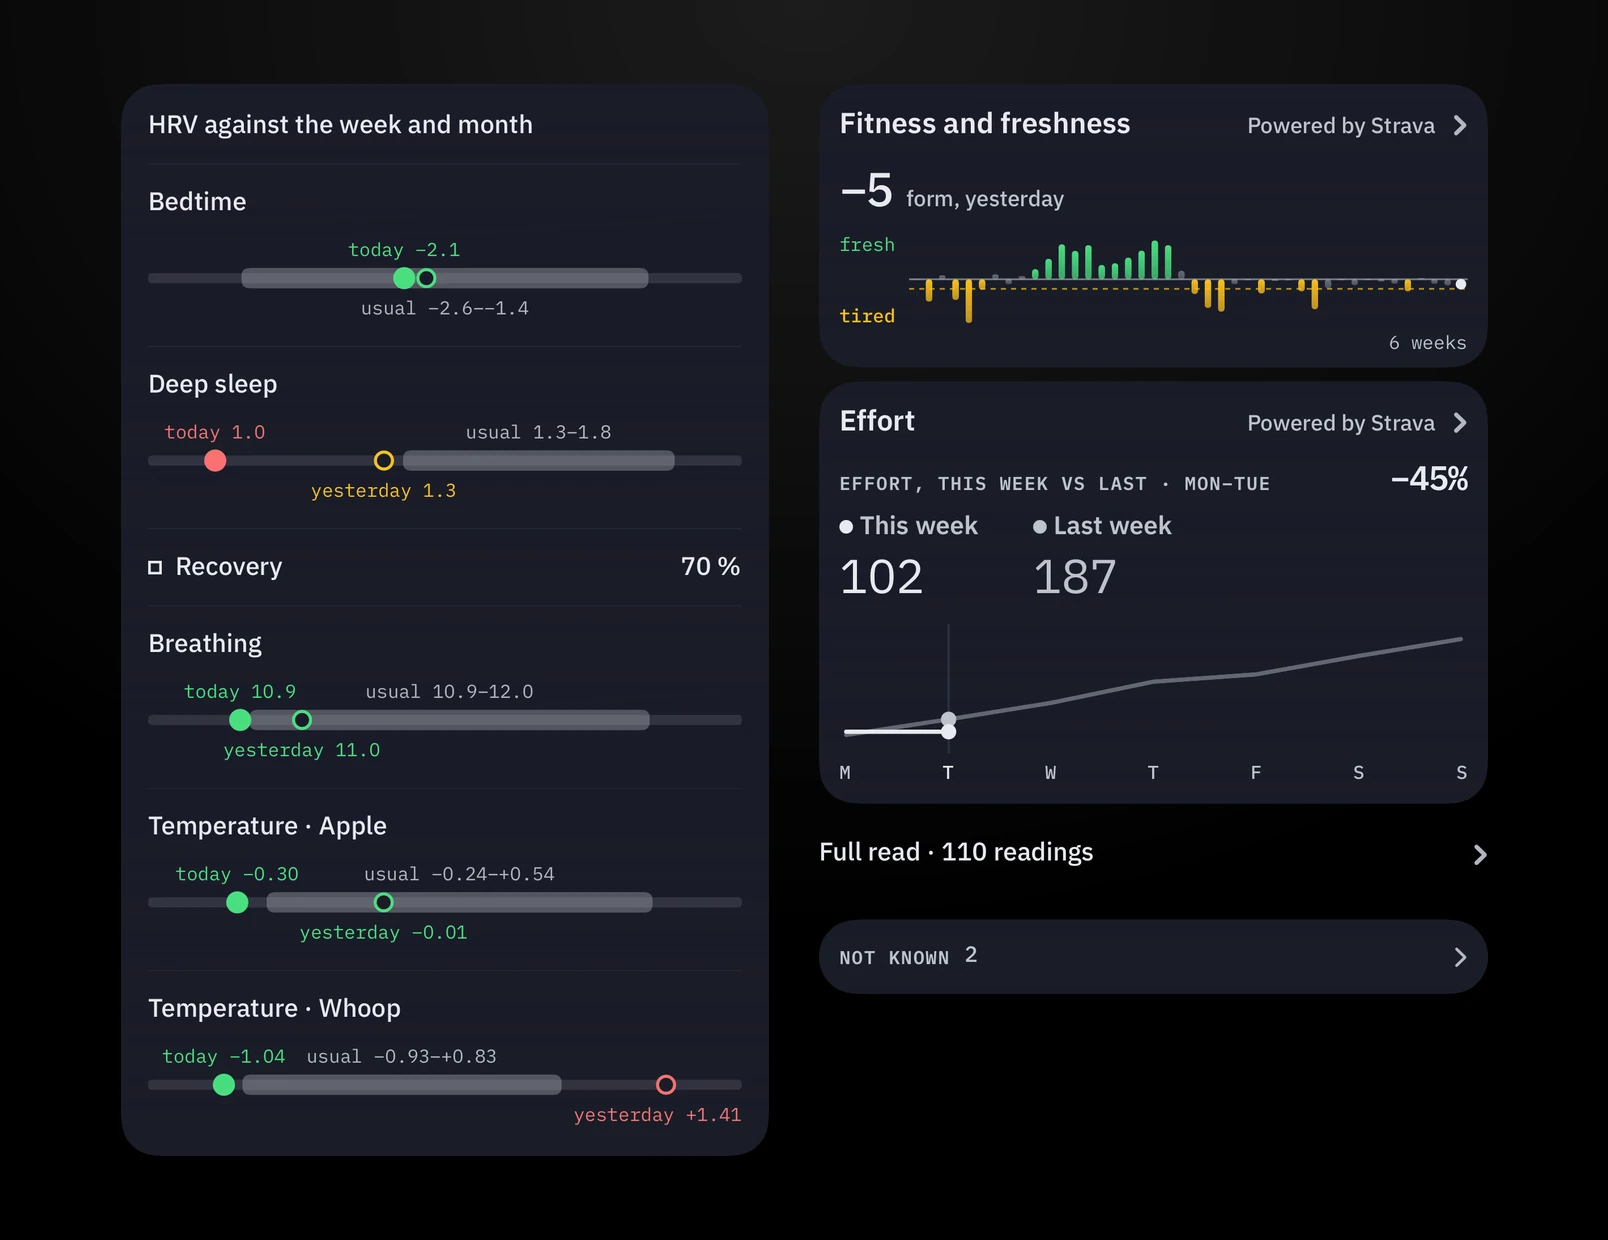
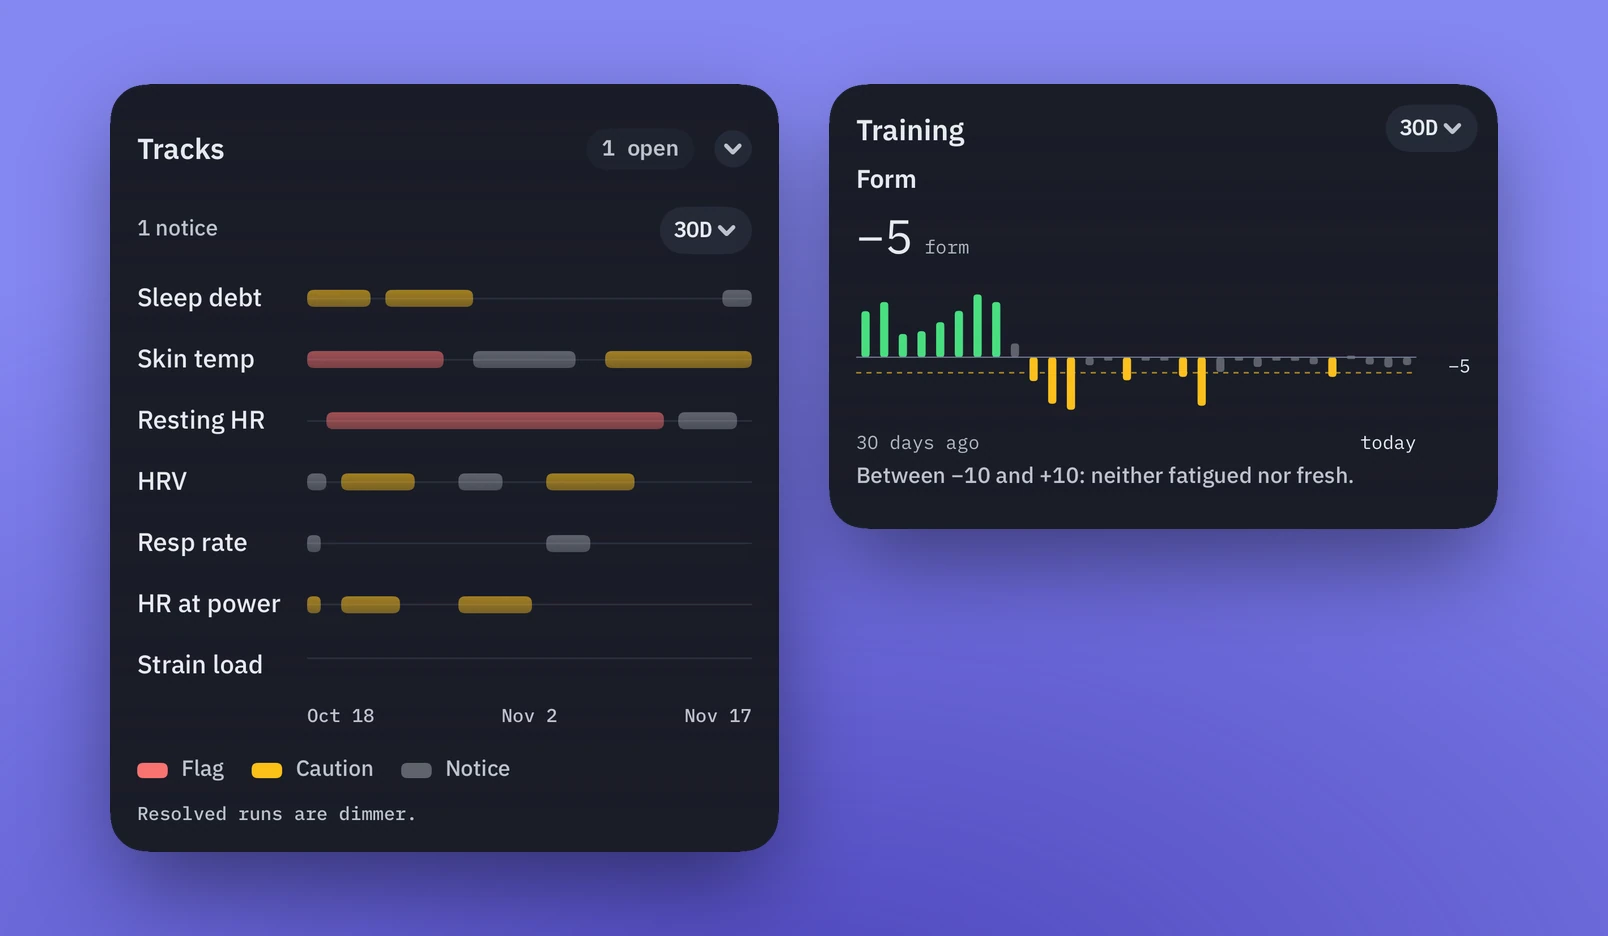
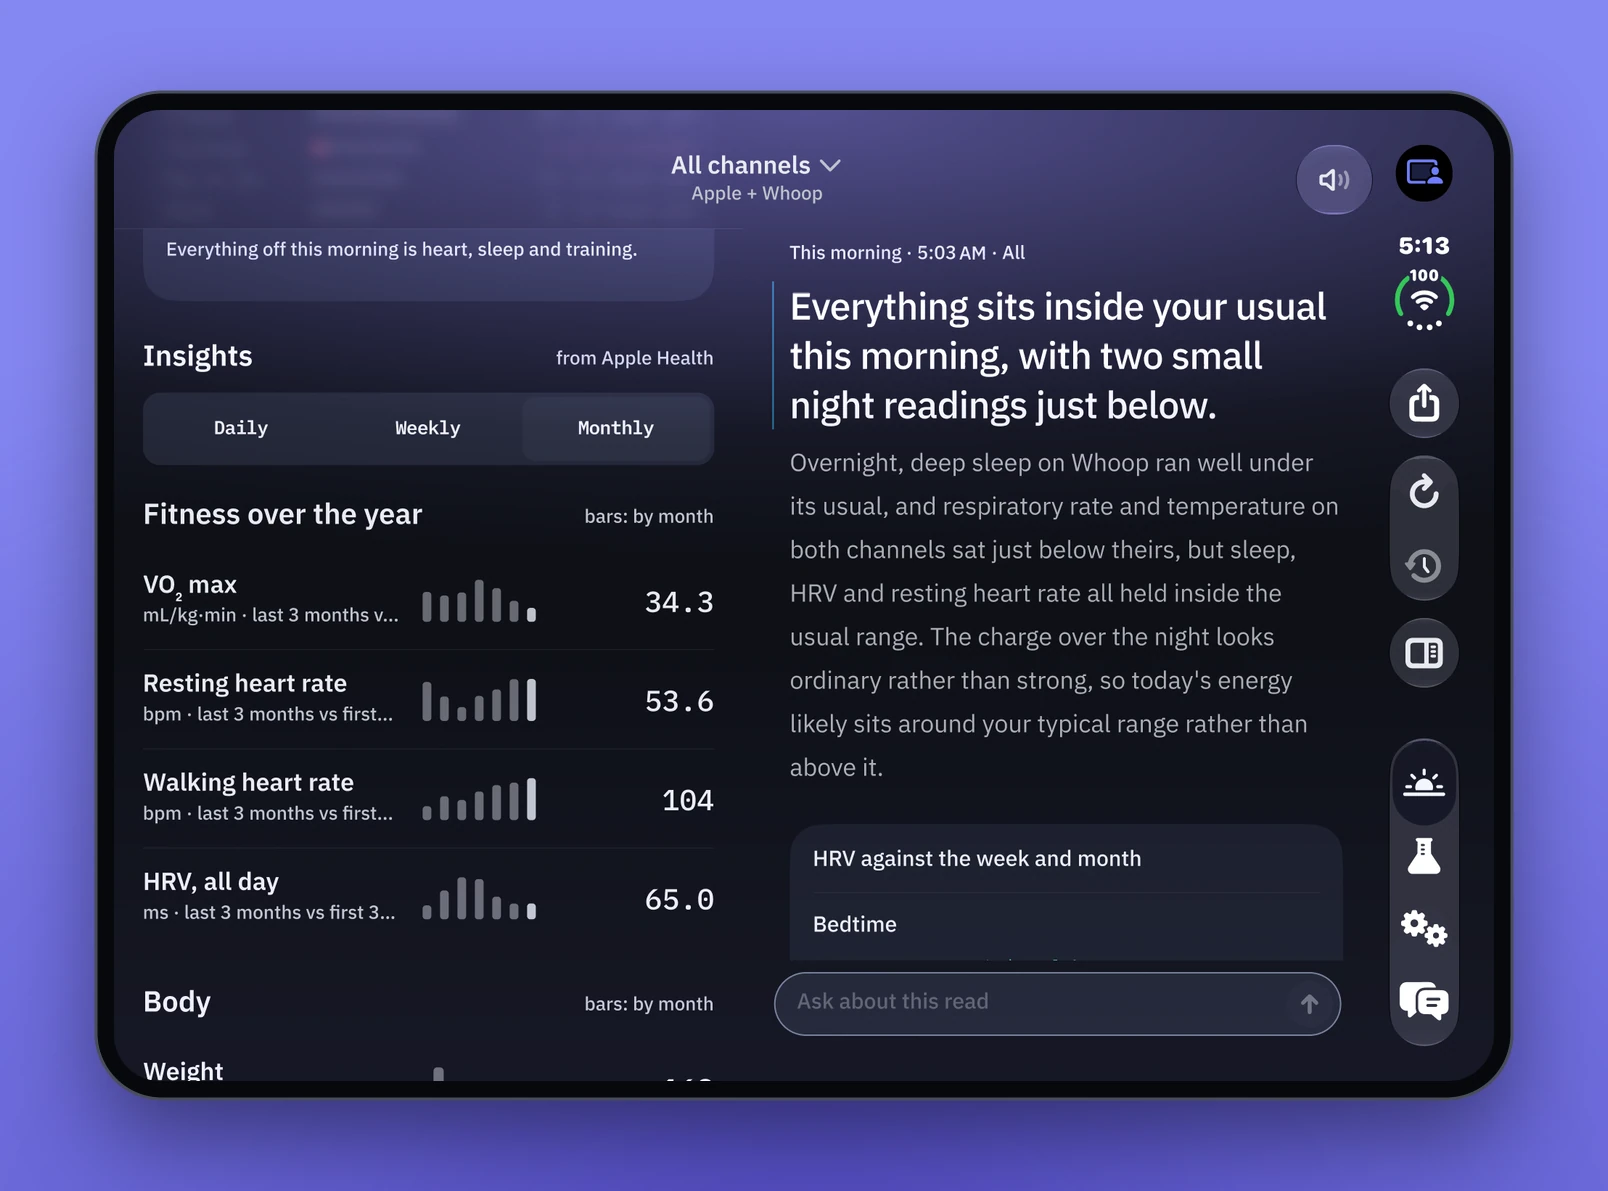
The dashboard displays the data in formats designed to go deeper the more I dig in. At the top is a high-level overview, and tapping any data point reveals more granular detail. As I scroll down, the view moves from today toward trends over time.
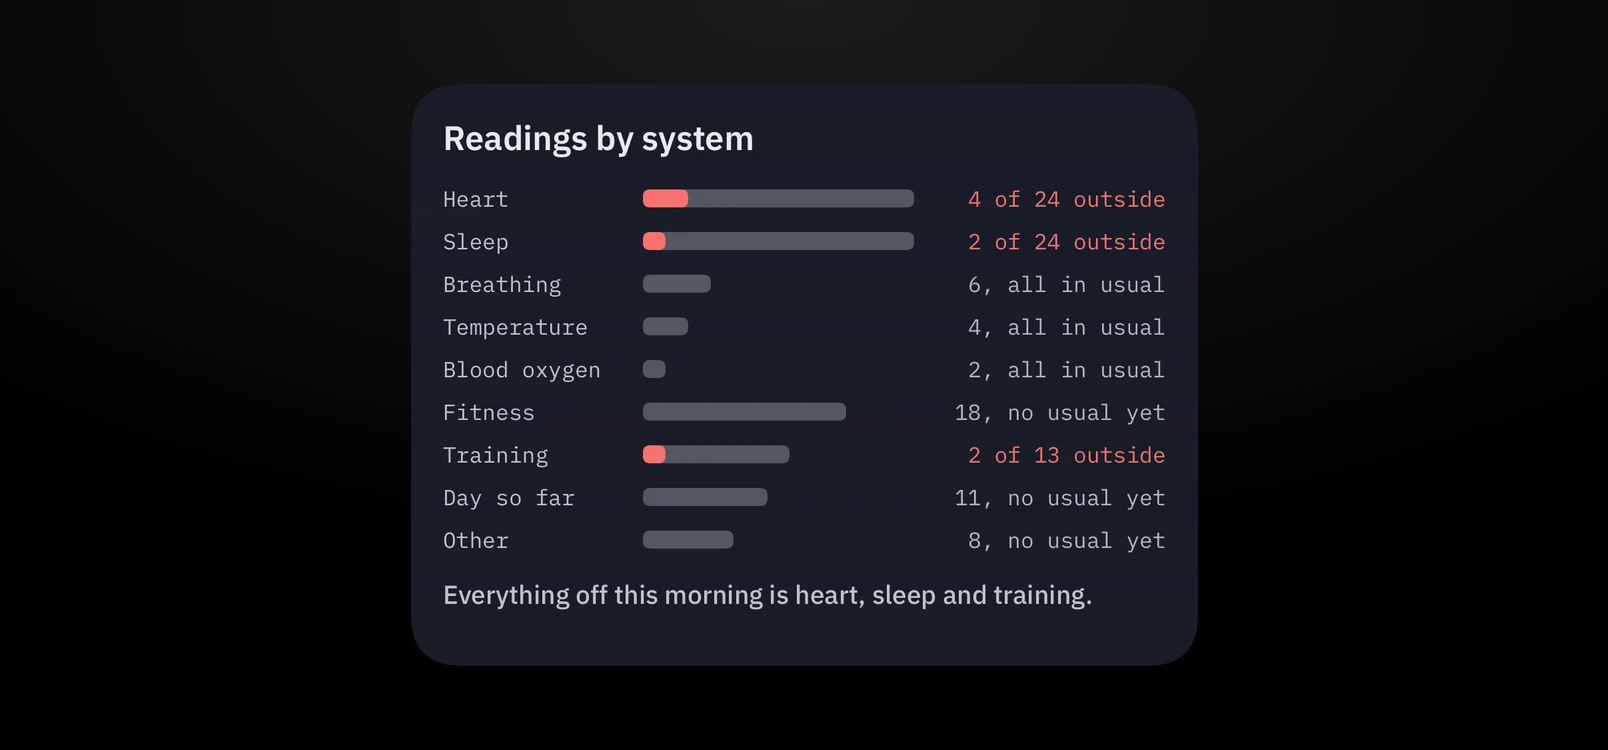
Two levels of fidelity.
Each data point first appears as a quick visual: a sparkline or graph using red, amber and green colors. It places today's value in context with my norm, or shows that it falls outside it. Because I'm often listening while I glance at the screen, it has to be easy to scan. Sparklines are instantly recognizable, whether they're green, amber or red, and whether they're trending up or down.
Tapping in places almost every data point in the context of the week, month and year, along with a plain-English reading of today's value.
A conversation with the data
The chat interface is designed to be both conversational and informative. It's there to encourage me to ask questions of the data.
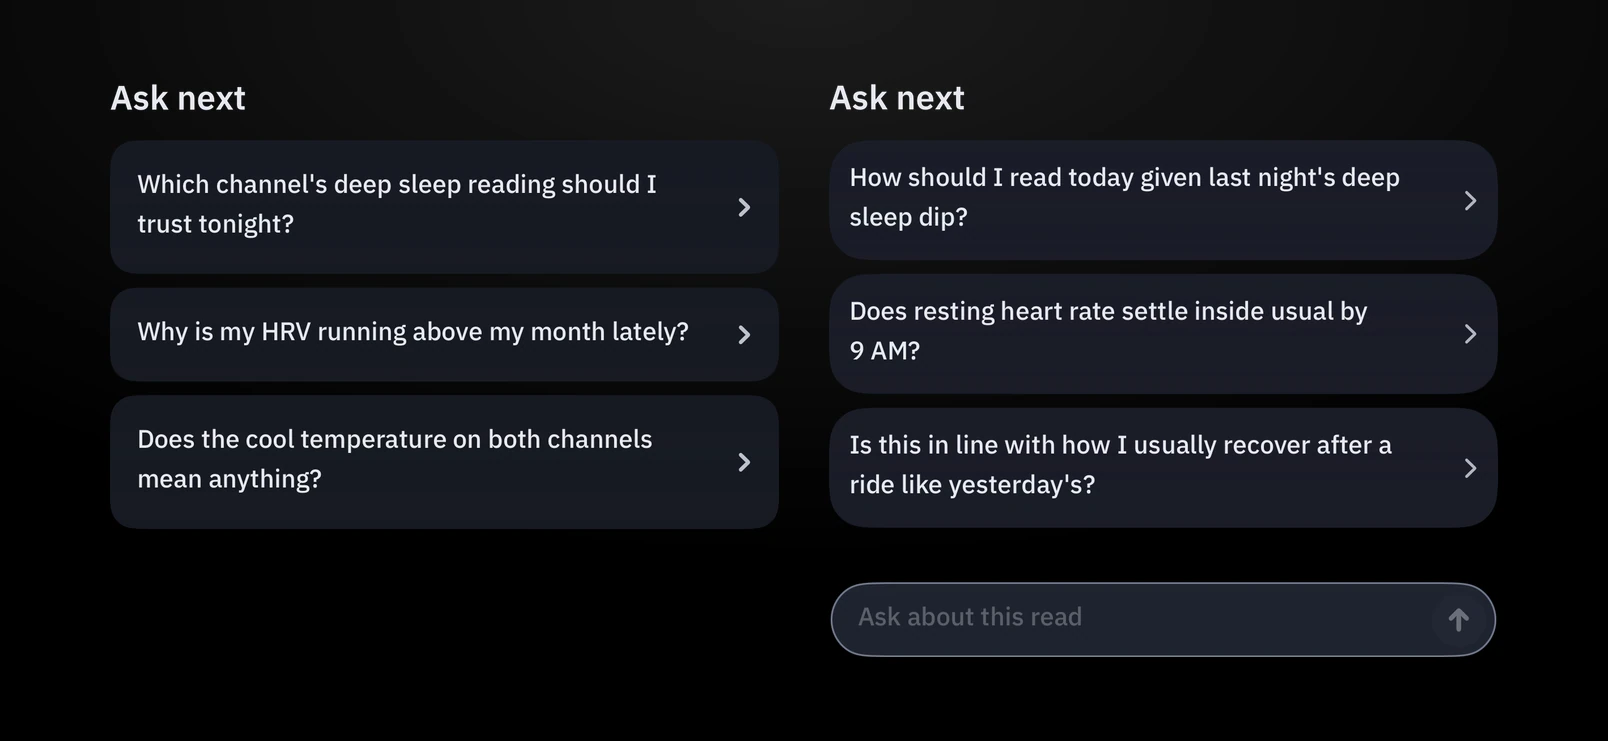
That's why the chat evolved from an optional extra into the entry point. It could be more dynamic in how it analyzed the data. Now it's the first thing that loads, with a quick visual of the sourced data. If something triggers a question, I can ask it right away, even if the suggested prompts aren't what's on my mind.
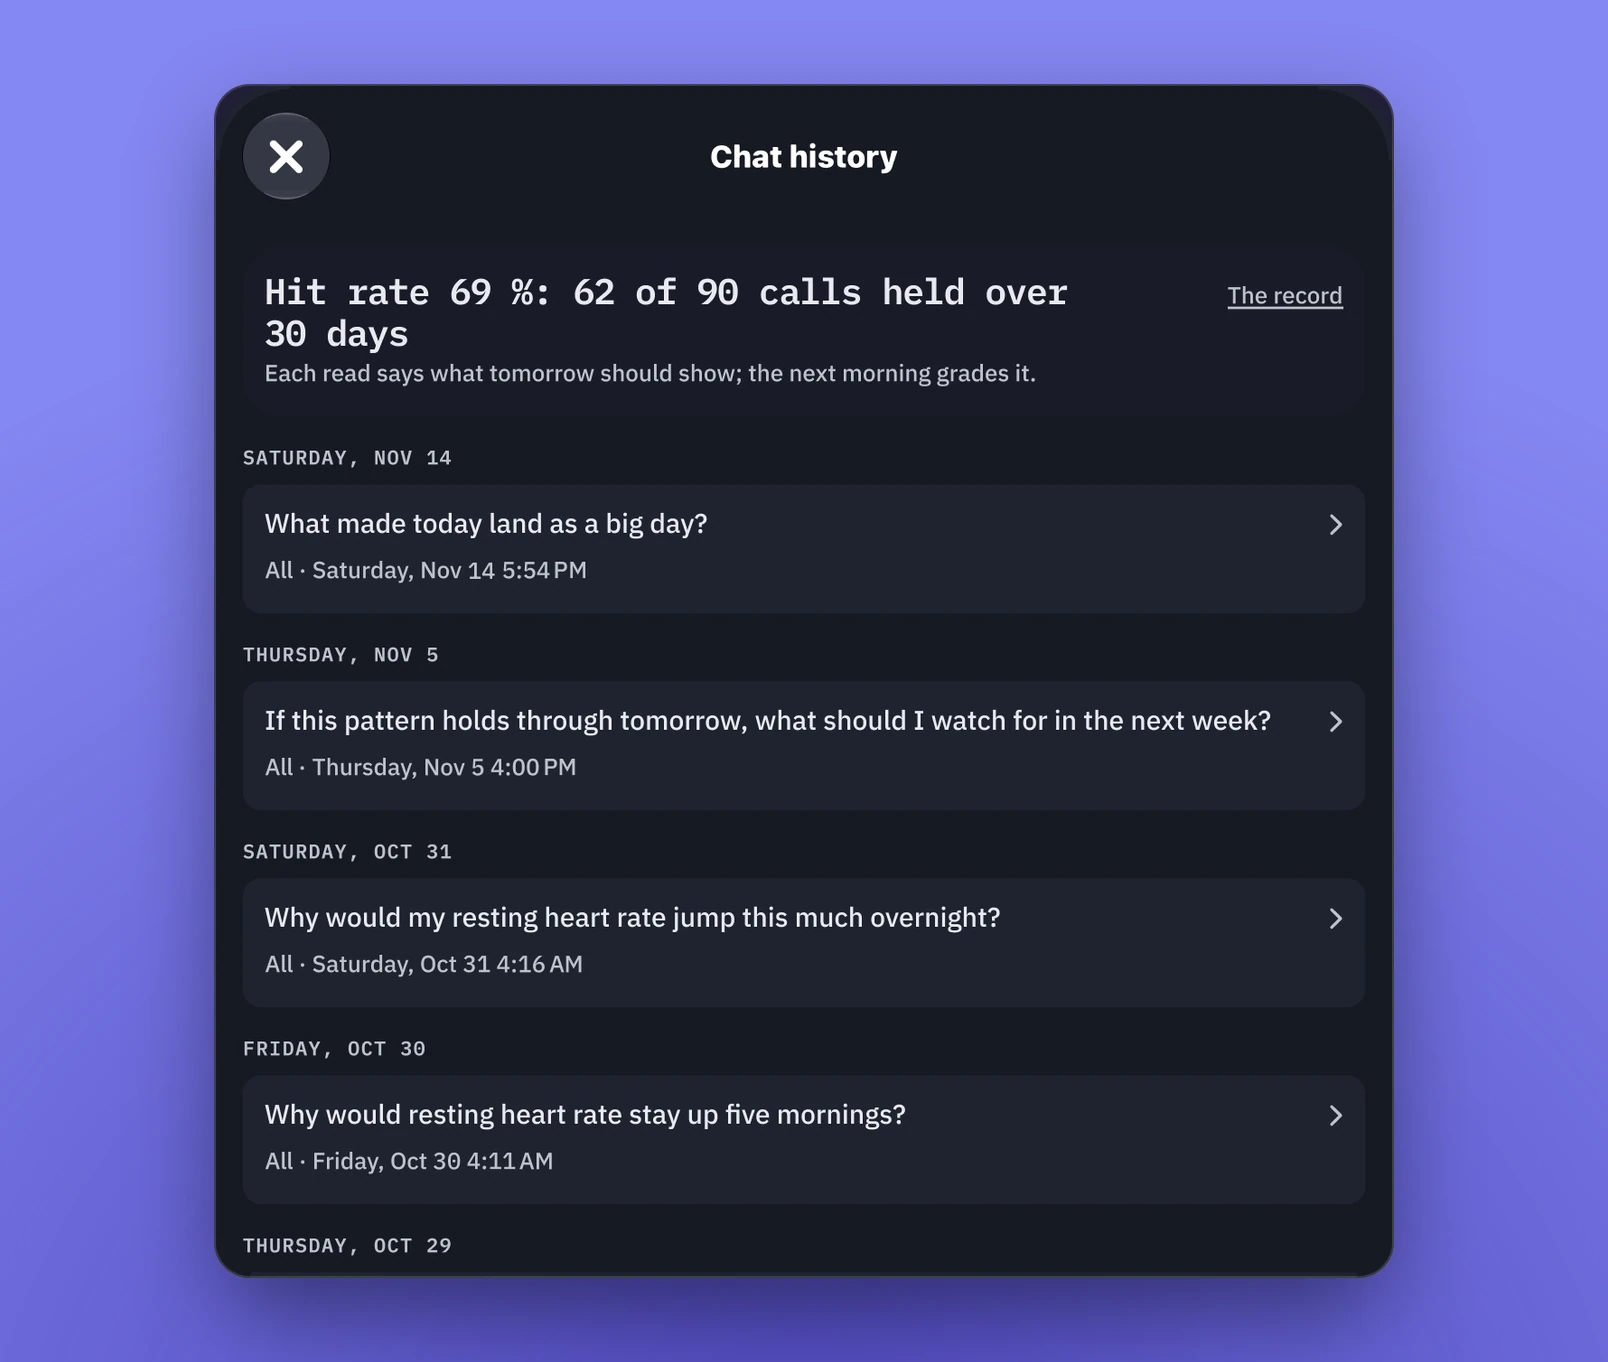
Each screen is meant to be read on its own, but in landscape mode the two come together: the dashboard on the left, the chat on the right. When the data highlights something I want to understand better, this gives me a clear way to have a conversation with it.
In short
That's what Signal gives me: control over how my data becomes information, and a way to learn about AI through numbers I already know. What started as every imaginable data point became a conversation about how my body is doing.